


Lotus Technology (Nasdaq: LOT) posted Q4 2025 EPS of -$0.14, beating the -$0.15 consensus estimate by 6.67%. Full-year revenue came in at $519M (down 44% YoY), while gross margin expanded sharply to 9% from 3%. Shares surged ~15.87% in premarket trading on earnings day, April 10, 2026, reflecting investor relief at the narrowing losses.
About Lotus Technology
Lotus Technology Inc. (Nasdaq: LOT) is a leading global intelligent and luxury mobility provider headquartered across the UK, EU, and China, with deep operational ties to Geely Holding Group. Founded as a luxury electric vehicle marque with origins tracing back to the iconic British Lotus Cars brand, the company went public via a SPAC merger completed in February 2024.
As of April 10, 2026, Lotus Technology had a market capitalization of approximately $991 million–$1.01 billion, with 678.9 million shares outstanding. The company employs approximately 1,996 people, translating to revenue per employee of roughly $260,069.
Its product portfolio includes the Eletre (lifestyle SUV), Emeya (electric sedan), and the newly launched For Me PHEV (also known as Eletre X in Europe), targeting the premium EV segment priced above RMB 400,000 in China. With a P/E ratio unavailable (losses ongoing) and EPS (TTM) of -$1.23, the company remains in a pre-profitability growth phase.
Top Financial Highlights
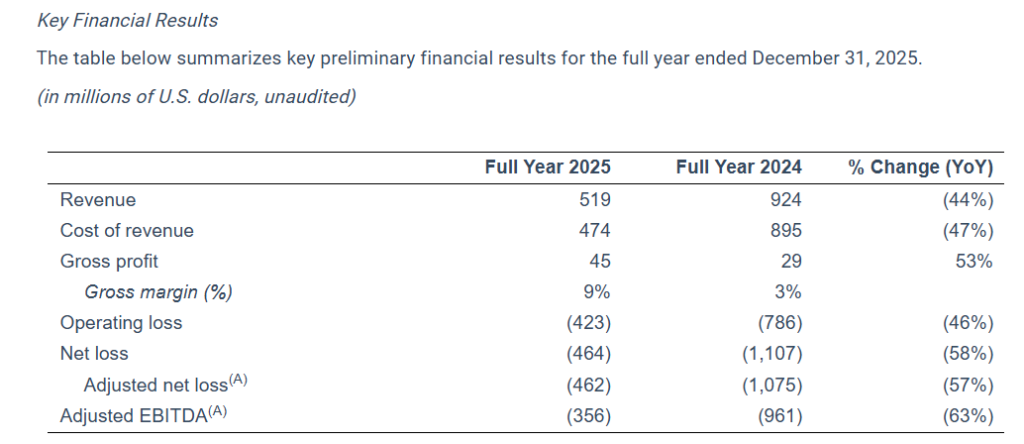
- Full-year total revenues reached $519 million, a 44% YoY decrease from $924 million in 2024
- Q4 2025 revenues were $163 million, down 40% YoY from $272 million in Q4 2024, but beat analyst estimates of $153.86 million by approximately $9.48 million
- Q4 2025 EPS of -$0.14, beating the consensus estimate of -$0.15; full-year EPS was -$0.72 vs. -$1.72 in 2024
- Gross margin expanded to 9% for the full year (vs. 3% in 2024), and to 10% in Q4 2025 vs. -11% in Q4 2024
- Net loss narrowed by 58% YoY to $464 million for the full year, and by 81% in Q4 to $86 million
- Adjusted EBITDA loss improved by 63% YoY to -$356 million (full year) and by 84% to -$62 million in Q4
- Operating loss narrowed 46% YoY to $423 million for the full year, and 65% YoY to $66 million in Q4
- Service revenues surged 69% YoY to $56 million in 2025, driven primarily by R&D licensing revenue (over 75% of service revenue)
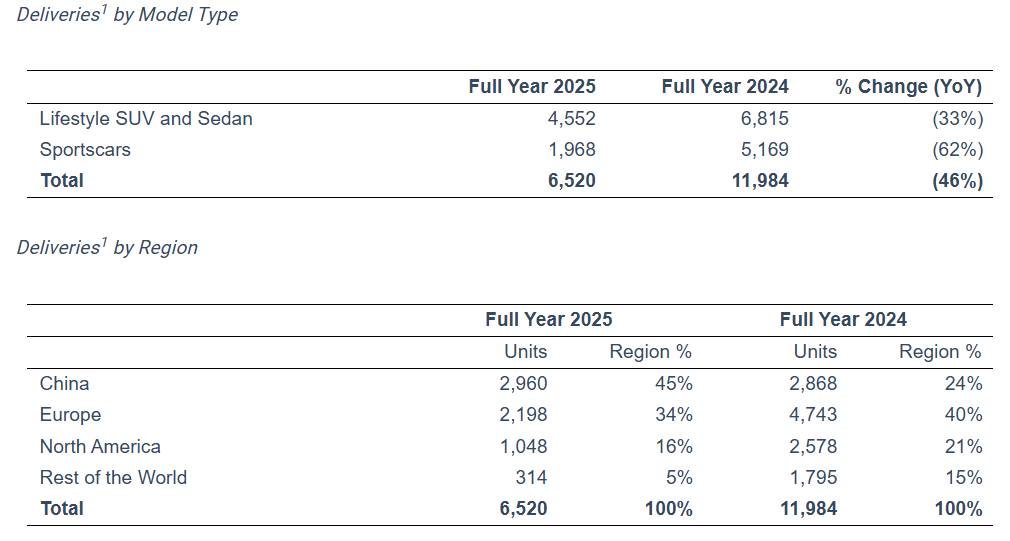
- Vehicle deliveries totaled 6,520 units in 2025, down 46% YoY from 11,984 units, with China accounting for 45% of deliveries
- Cash and cash equivalents stood at $73.4 million as of December 31, 2025 (vs. $103 million at end of 2024); restricted cash totaled $376 million (current) and $101 million (non-current)
- Sales of goods revenue: $462.8 million (FY2025) vs. $891 million (FY2024); R&D and related costs declined sharply
- ECARX strategic investment of $23 million via 16.79 million newly issued shares subscribed in December 2025, deepening technology partnership
Beat or Miss?
| Metric | Reported | Estimated / Expected | Difference / Analysis |
| Q4 2025 Revenue | $163.34M | $153.86M | Beat by +$9.48M (+6.2%) |
| Q4 2025 EPS (Basic, diluted) | ($0.14) | ($0.15) | Beat by $0.01 (6.67% upside) |
| Full Year 2025 Revenue | $519.1M | N/A (consensus not disclosed) | Down 44% YoY; transitional year |
| Full Year 2025 Net Loss | -$464.2M | N/A | Improved 58% YoY from -$1,107M |
| Full Year 2025 Gross Margin | 9% | N/A | Significant improvement from 3% in 2024 |
| Q4 2025 Gross Margin | 10% | N/A | Swing of +21 ppts from -11% in Q4 2024 |
| Full Year 2025 Adj. EBITDA | -$356M | N/A | Improved 63% YoY from -$961M |
What Leadership Is Saying?
CEO – Strategy and Vision
“Despite the external headwinds facing our business, we maintained our Company’s mission and strategy by doubling down on cutting-edge technologies, refining our product mix, and providing an industry-leading driving performance. Our established global footprint is the impetus that allows us to seize first-mover gains and enables us to become the world’s second automaker to obtain UN R171.01 certification. Our differentiation and dedication to executing our growth and innovation strategy – represented by the launch of our first PHEV vehicle, which further enriches our powertrain offerings – together with our diversified product portfolio, provide us with the foundation to remain competitive in the market.” – Qingfeng Feng, Chief Executive Officer, Lotus Technology Inc.
CFO – Financials and Margin Outlook
“Our improved margin performance in the fourth quarter and full year of 2025 demonstrated our continued focus on cost optimization and operational efficiency, and was also reflected in our significantly improved bottom line results. Going forward, we expect the global launch of ‘For Me’ to supercharge sales and revenue. Additionally, we expect that by focusing on revenue growth efforts, maximizing our products and competitive positioning, and enhancing margin expansion through strict cost reductions, our business will progress toward profitability and we will deliver long-term value to our shareholders.”– Dr. Daxue Wang, Chief Financial Officer, Lotus Technology Inc.
Historical Performance
Lotus Technology YoY (Q4 2025 vs. Q4 2024)
| Category | Q4 2025 | Q4 2024 | Change (%) |
| Total Revenue | $163M | $272M | -40% |
| Gross Profit (Loss) | $16.5M | -$29.5M | +156% (swing to profit) |
| Gross Margin | 10% | -11% | +21 ppts |
| Operating Loss | -$66M | -$189M | -65% (improvement) |
| Net Loss | -$86M | -$440M | -81% (improvement) |
| Adjusted EBITDA | -$62M | -$398M | -84% (improvement) |
| EPS (Basic/Diluted) | ($0.14) | ($0.66) | -79% loss reduction |
| Vehicle Deliveries | 1,908 units | 4,311 units | -56% |
| Service Revenue | $30.9M | $4.7M | 556% |
Competitor Comparison
Revenue, Net Income, Operating Loss (FY2025 vs. FY2024)
| Category | Lotus Technology FY2025 | Lotus Technology FY2024 | Change (%) | NIO FY2025 | NIO FY2024 | Change (%) | Polestar 9M 2025 | Polestar 9M 2024 | Change (%) |
| Total Revenue | $519M | $924M | -44% | ~$12.2B | ~$9.2B | 33% | $2,171M | $1,459M | 49% |
| Net Income / (Loss) | -$464M | -$1,107M | -58% (improved) | -$2.2B (est.) | -$3.2B (est.) | -32% (improved) | -$1,558M | -$867M | +80% (worsened) |
| Gross Margin | 9% | 3% | +6 ppts | ~14.6% | ~9.7% | improving | Negative (impairment) | Negative | N/A |
Key Observations
- NIO delivered 326,028 vehicles in 2025 (+47% YoY) and achieved its first quarterly operating profit in Q4 2025, underscoring the scale advantage that larger luxury EV players hold over Lotus Technology
- Polestar achieved strong revenue growth of 49% in its first nine months of 2025, driven by volume expansion and higher-margin model mix (Polestar 3 and 4), though it remained unprofitable
- Lotus Technology leads its peer group in margin recovery pace, with gross margin moving from -11% to +10% in a single quarter, while maintaining the tightest absolute cost base
How the Market Reacted?
Lotus Technology shares rallied approximately 15.87% in premarket trading on April 10, 2026, following the earnings release. The stock closed at $1.49 on the reporting day, up from $1.46 the prior session. After hours on April 10, shares pulled back to $1.40, a decline of 6.04%, suggesting some profit-taking after the pre-market surge.
The market reaction was broadly bullish, driven by the narrowing of losses at a pace far exceeding expectations, the Q4 revenue beat versus consensus, and the gross margin swing from -11% to +10%. Investor optimism also reflected the strategic milestone of launching the For Me PHEV and the UN R171.01 certification for Eletre, the first China-built model to achieve this regulatory standard. Despite the stock being down approximately 44% over the six-month period ending on earnings day, the week of the announcement saw a gain of nearly 31.86%, indicating a meaningful sentiment shift.