


Ryder System reported GAAP EPS of $2.34 and comparable EPS of $2.54 for Q1 2026, with total revenue essentially flat at $3.1 billion and operating revenue of $2.6 billion. Management raised full year 2026 EPS guidance, signaling a constructive outlook despite modest top line pressure and mixed segment trends.
About Ryder System
Ryder System, Inc. (NYSE: R) is a transportation and logistics company that provides fleet management, supply chain, and dedicated transportation solutions to customers across industries such as automotive, retail, consumer goods, healthcare, and industrials. Headquartered in Miami, Florida, Ryder traces its roots back to 1933 and today operates as a key component of the Dow Jones Transportation Average and the S&P MidCap 400 index.
The company organizes its operations into three primary segments: Fleet Management Solutions (FMS), Supply Chain Solutions (SCS), and Dedicated Transportation Solutions (DTS), each offering leased vehicles, maintenance, rental, logistics engineering, and contract carriage services.
Ryder reported total assets of $16.2 billion and shareholders’ equity of $2.9 billion as of March 31, 2026, with a debt to equity ratio of 269%, within its targeted leverage band. The business continues to generate strong cash flows, supported by a high-quality contractual portfolio and a non GAAP adjusted return on equity of 17% over the twelve months ended March 31, 2026.
Top Financial Highlights
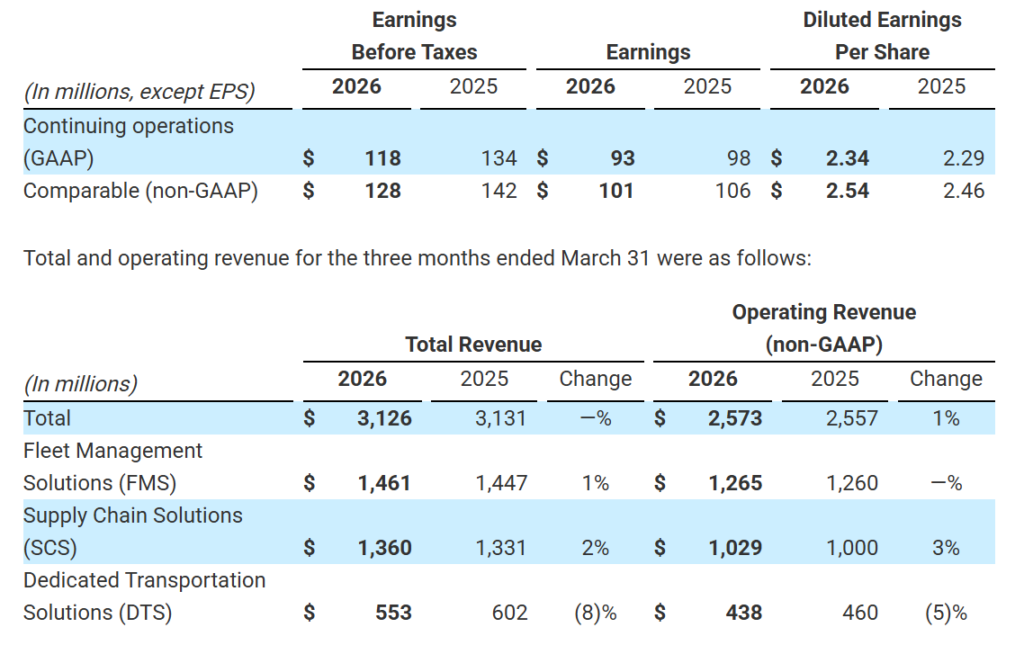
- GAAP EPS from continuing operations of $2.34, up 2% year over year.
- Comparable EPS (non GAAP) from continuing operations of $2.54, up 3% year over year, primarily reflecting share repurchases partially offset by lower earnings.
- Total revenue of $3.13 billion (reported as $3,126 million), essentially unchanged versus $3.13 billion in Q1 2025.
- Operating revenue (non GAAP) of $2.57 billion (reported as $2,573 million), up 1% from $2.56 billion in the prior year.
- Net earnings from continuing operations of $93 million, down from $98 million in the prior year quarter.
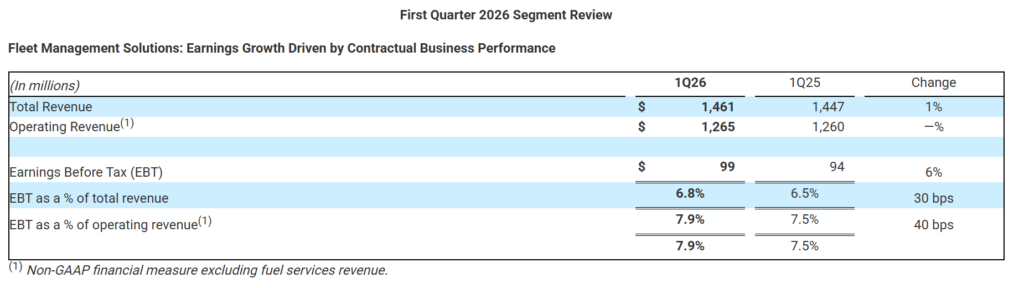
- Fleet Management Solutions total revenue of $1.46 billion, up 1%, with operating revenue of $1.27 billion essentially flat year over year.
- Supply Chain Solutions total revenue of $1.36 billion, up 2%, and operating revenue of $1.03 billion, up 3%, driven by new omnichannel retail business partially offset by weaker automotive volumes.
- Dedicated Transportation Solutions total revenue of $553 million, down 8%, and operating revenue of $438 million, down 5%, reflecting a lower fleet count amid a prolonged freight downturn.
- Earnings before tax (EBT) from continuing operations of $118 million, compared with $134 million in Q1 2025, with segment EBT of $99 million in FMS, $72 million in SCS and $23 million in DTS.
- Effective tax rate from continuing operations of 21.0%, down from 26.8%, aided by excess tax benefits on stock based compensation.
- Net cash from operating activities from continuing operations of $583 million, versus $651 million a year ago, while free cash flow (non GAAP) improved to $273 million from $259 million due to lower capital expenditures.
- Capital expenditures of $409 million, down from $536 million, reflecting timing of ChoiceLease fleet replacement and reduced rental investments.
- Full year 2026 GAAP EPS guidance raised to $13.15–$13.90 and comparable EPS guidance increased to $14.05–$14.80, with total and operating revenue growth still targeted at 3%.
- Debt to equity ratio at 269% as of March 31, 2026, up from 250% at year end 2025 yet within the stated long term target range of 250%–300%.
Beat or Miss?
| Metric | Reported | Difference / Analysis |
| GAAP EPS (continuing ops) | $2.34 | Above prior year $2.29; external sources flag an EPS beat versus consensus. |
| Comparable EPS (non GAAP) | $2.54 | Up from $2.46; reflects share repurchases offsetting slightly lower earnings. |
| Total revenue | $3.13 billion | Flat year over year; some third party data show a modest revenue miss vs estimates. |
| Operating revenue (non GAAP) | $2.57 billion | Up 1%; broadly consistent with guidance for low single digit growth. |
| Net earnings (cont. ops) | $93 million | Down from $98 million, reflecting softer SCS and DTS earnings. |
| FY26 GAAP EPS guidance | $13.15–$13.90 | Raised range signals improved full year expectations. |
| FY26 comparable EPS guidance | $14.05–$14.80 | Increased from prior outlook, implying confidence in earnings power. |
What Leadership Is Saying?
“The Ryder team delivered solid first quarter results that exceeded our expectations. Outperformance was driven by used vehicle sales results in FMS. Our results continue to demonstrate the earnings power and resiliency of our transformed business model.” – John Diez, Chief Executive Officer, Ryder System, Inc.
“We are on track for another year of earnings growth in 2026, driven by execution on $70 million in incremental benefits from strategic initiatives. We are raising our EPS forecast range to reflect stronger than expected first quarter performance and our expectations for modest improvement in used vehicle market conditions.”– Cristina Gallo Aquino, Chief Financial Officer, Ryder System, Inc.
Historical Performance
Ryder’s Q1 2026 profile shows stable revenue with slightly lower profitability compared to the same quarter last year, as segment mix and freight conditions weighed on margins.
| Category | Q1 2026 | Q1 2025 | Change (%) |
| Revenue (Total) | $3,126 million | $3,131 million | Approximately 0% decline (flat). |
| Net income (cont. ops) | $93 million | $98 million | About (5%) decline. |
| Operating revenue | $2,573 million | $2,557 million | Around 1% growth. |
| EBT (continuing ops) | $118 million | $134 million | Roughly (12%) decline |
How the Market Reacted?
Ryder’s release does not specify share price moves on the day of the announcement, but external coverage notes that the company’s EPS performance exceeded expectations and that the stock traded positively following the print. The raised full year EPS guidance and reaffirmed 3% operating revenue growth outlook underscore a constructive management stance despite flat reported revenue and segment level pressure in SCS and DTS.
Investors are likely to view the quarter as fundamentally solid, supported by resilient contractual revenue, improving used vehicle trends, and healthy free cash flow generation. Overall sentiment around the results appears more bullish than bearish, with the key watch points remaining freight cycle normalization and execution on the targeted $70 million in strategic initiative benefits.