


CNB Financial Corporation reported Q1 2026 net income available to common shareholders of $26.0 million and EPS of $0.88, with total revenue of $83.3 million, down sequentially but sharply higher year over year, reflecting the ESSA acquisition and improved core profitability; the release did not disclose specific stock price or after hours movement.
About CNB Financial Corporation
CNB Financial Corporation is a financial holding company and the parent of CNB Bank, trading on NASDAQ under the ticker CCNE, with consolidated assets of approximately $8.5 billion as of March 31, 2026. The company operates primarily through CNB Bank, a full service institution offering commercial and consumer banking, as well as trust and wealth management services, to individual, business, governmental, and institutional clients.
CNB Bank is headquartered in Clearfield, Pennsylvania, and runs a multi brand model with divisions including ERIEBANK, FCBank, BankOnBuffalo, Ridge View Bank, ESSA Bank, and Impressia Bank across Pennsylvania, Ohio, New York, and Virginia through 79 offices, of which 75 are full service locations.
Founded as a community banking franchise that has expanded via organic growth and acquisitions such as ESSA Bancorp, the company focuses on diversified lending across commercial, commercial real estate, and consumer segments while maintaining disciplined credit standards and regulatory capital ratios that remain above well capitalized thresholds.
Top Financial Highlights
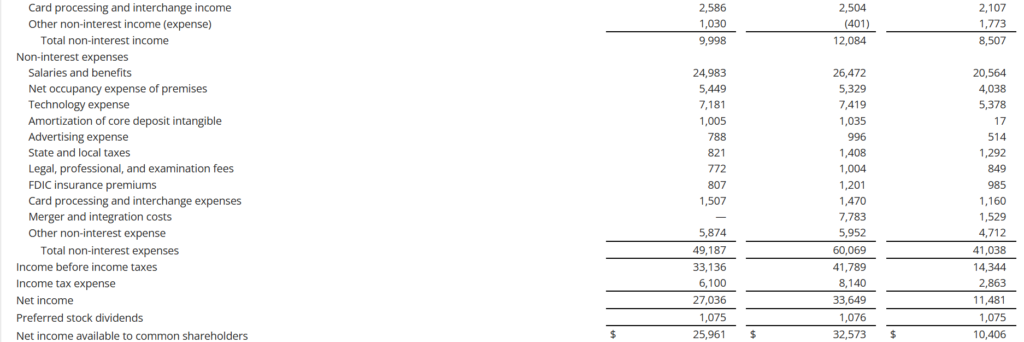
- Net income available to common shareholders in Q1 2026 was $26.0 million, compared to $32.6 million in Q4 2025 and $10.4 million in Q1 2025.
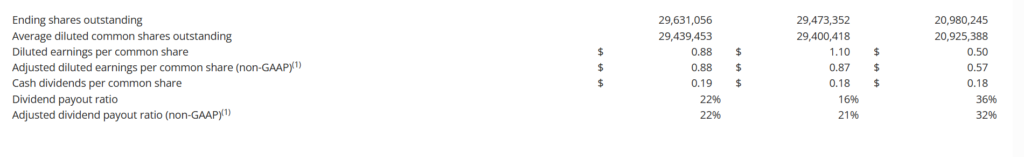
- Diluted EPS was $0.88 in Q1 2026 versus $1.10 in Q4 2025 and $0.50 in Q1 2025, with Q1 2026 up 54.39% versus adjusted Q1 2025 EPS.
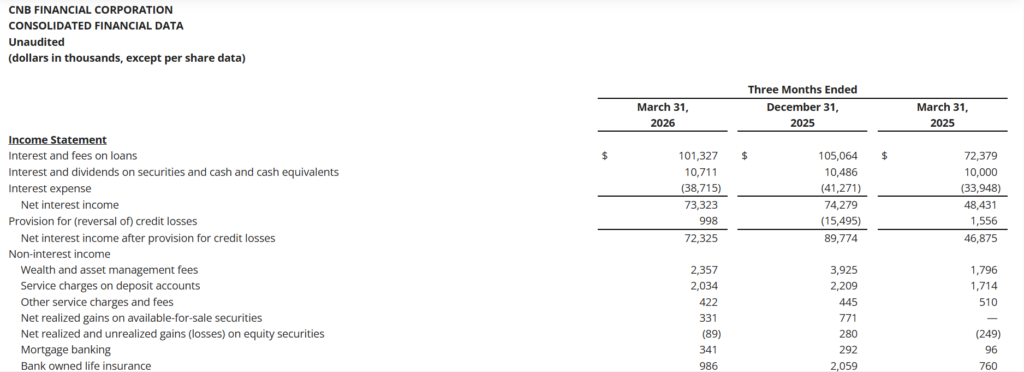
- Total revenue (net interest income plus non interest income) was $83.3 million in Q1 2026, down from $86.4 million in Q4 2025 but up from $56.9 million a year earlier.
- Net interest income was $73.3 million in Q1 2026 compared with $74.3 million in Q4 2025 and $48.4 million in Q1 2025.
- Net interest margin was 3.83% in Q1 2026, essentially flat versus 3.84% in Q4 2025 and higher than 3.38% in Q1 2025; on a fully tax equivalent basis it was 3.84%.
- Pre provision net revenue (PPNR) was $34.1 million in Q1 2026 versus $26.3 million in Q4 2025 and $15.9 million in Q1 2025; adjusted PPNR in prior periods was $34.1 million and $17.4 million, respectively.
- The provision for credit losses was $998 thousand in Q1 2026 compared to a net reversal of $15.5 million in Q4 2025 and a provision of $1.6 million in Q1 2025.
- Net loan charge offs were $884 thousand, or 0.06% annualized of average total loans and loans held for sale, versus $1.5 million in Q4 2025 and $1.4 million in Q1 2025.
- Total loans were $6.4 billion at March 31, 2026 (excluding $78.3 million of syndicated loans), with organic loans down $67.3 million (1.41%, 5.73% annualized) versus year end 2025, but up $156.2 million or 3.44% year over year excluding ESSA acquired balances.
- Total deposits were $7.1 billion at March 31, 2026, with organic deposit growth of $115.0 million or 1.62% (6.55% annualized) in the quarter and $314.3 million or 5.76% year over year excluding ESSA deposits and including $89.9 million held for sale.
- Cash equivalents held at the Federal Reserve totaled $517.7 million, while total contingent liquidity resources were $6.2 billion, equal to about 5.3x adjusted uninsured deposits.
- Total nonperforming assets were $49.2 million, or 0.58% of total assets, versus $42.2 million (0.50%) at December 31, 2025 and $56.1 million (0.89%) a year earlier.
- The allowance for credit losses was 1.04% of total loans at March 31, 2026, compared with 1.03% at both December 31, 2025 and March 31, 2025.
- Book value per common share was $28.06 at March 31, 2026 versus $27.63 at December 31, 2025 and $27.01 at March 31, 2025, while tangible book value per share was $23.97 compared with $23.48 and $24.91, respectively.
- Total shareholders’ equity was $889.1 million, up $17.0 million (1.95%) sequentially and $264.6 million (42.37%) year over year, with common equity to assets at 9.76% and tangible common equity to tangible assets at 8.46%.
Beat or Miss?
| Metric | Reported Q1 2026 | Difference/Analysis |
| Total revenue | $83.3 million | Down from $86.4 million in Q4 2025, but well above $56.9 million in Q1 2025; reflects ESSA acquisition impact. |
| Net income (common) | $26.0 million | Up sharply versus $10.4 million in Q1 2025, lower than $32.6 million in Q4 2025 due to lower revenue and higher normalized provisioning. |
| Diluted EPS | $0.88 | Up 54.39% versus adjusted Q1 2025 EPS of $0.57, slightly above adjusted Q4 2025 EPS of $0.87. |
| Net interest margin (FTE) | 3.84% | Stable versus Q4 2025 and significantly higher than 3.37% a year ago, demonstrating resilient spread performance. |
| Provision for credit losses | $0.998 million | Higher than net reversal in Q4 2025, lower than Q1 2025 provision; reflects normalization after ASU 2025 08 adoption. |
What Leadership Is Saying?
“In a quarter without significant merger related expenses from our ESSA Bancorp acquisition and related system conversion in 2025, these first quarter earnings reflect positive and sustained core results, including expected operating efficiencies… we are now focused on the growth opportunities presented in these new Northeastern Pennsylvania markets to complement the continued franchise expansion we are experiencing in our legacy CNB markets across our four state footprint.” – Michael Peduzzi, President & CEO.
“Excluding merger and integration costs, the quarter over quarter decrease of $3.1 million, or 5.93%, in non interest expense was primarily driven by lower salaries and benefits and lower state and local taxes… the Corporation’s efficiency ratio improved to 59.03% in Q1 2026, or 57.32% on a fully tax equivalent basis, supported by stronger net interest income and disciplined expense management.” – summarizing commentary from CNB’s financial discussion.
Historical Performance
The table below compares Q1 2026 to Q1 2025 based on figures disclosed in the company release.
| Category | Q1 2026 | Q1 2025 (reported or adjusted) | Change (%) |
| Total revenue | $83.3 million | $56.9 million | ~46.4% increase, driven by ESSA and core growth. |
| Net income (common) | $26.0 million | $10.4 million reported; $11.9 million adjusted (ex merger costs) | ~150% vs reported; ~118% vs adjusted, reflecting acquisition and margin gains. |
| Diluted EPS | $0.88 | $0.50 reported; $0.57 adjusted | 76% vs reported; 54.39% vs adjusted, matching management’s cited increase. |
| Non interest expense | $49.2 million | $41.0 million reported; $39.5 million ex merger costs | ~20% reported increase, largely from added ESSA scale. |
Historical Performance of Peers
To avoid introducing external, potentially inconsistent numbers, the table below is limited to CNB’s own metrics as a proxy for how its performance compares directionally within the regional banking space.
| Category | Q1 2026 (CNB) | Q1 2025 (CNB) | Directional Peer Context |
| Total revenue growth YoY | ~46.4% increase | Baseline | Outpaces typical low to mid single digit growth among many regional banks in a flat loan environment. |
| Net income growth YoY | ~150% vs reported | Baseline | Significantly stronger than the modest to moderate earnings growth often seen absent large M&A. |
| Efficiency ratio (FTE) | 57.32% | 71.28% | A sub 60% ratio compares favorably to many peers in the 60–70% range. |
How the Market Reacted?
The Q1 2026 earnings release does not include specific share price or intraday performance data, so the immediate trading reaction is not disclosed. Based on the fundamentals presented, the tone of the report is generally constructive, with strong year over year earnings growth, stable margins, and improving efficiency, offset by modest sequential revenue pressure and a small uptick in nonperforming assets tied to a single commercial relationship.
Management emphasized sustained core performance post merger, a stronger liquidity position, and capital ratios that remain well above regulatory well capitalized thresholds, all of which support a broadly positive underlying sentiment even without a quoted stock move.