


GE Aerospace reported Q1 2026 GAAP revenue of $12.4 billion and adjusted EPS of $1.86, both up strongly year on year and ahead of expectations, while free cash flow reached $1.7 billion. Despite the beat, shares fell about 4-6% after the release as investors focused on unchanged full‑year guidance and macro risks including higher fuel costs and geopolitical uncertainty.
About GE Aerospace
GE Aerospace (NYSE: GE) is a global aerospace propulsion, services, and systems company that designs, manufactures, and services jet engines for commercial and military aircraft. The company traces its roots back more than a century as part of General Electric, with GE Aerospace operating today as a focused aviation business headquartered in Cincinnati, Ohio.
It supports an installed base of about 50,000 commercial and 30,000 military engines worldwide, giving it a large recurring services revenue stream. GE Aerospace employs roughly 57,000 people globally. The company generates revenue from commercial engines and services, as well as defense and propulsion technologies, including military engines and additive manufacturing.
Management emphasizes a strategy centered on expanding its commercial services backlog, which stood at about $170 billion at quarter‑end, and investing in next‑generation technologies like the CFM RISE open fan architecture. The shares currently trade on a multiple consistent with large‑cap aerospace peers, and the board recently raised the quarterly dividend to $0.47 per share as part of its capital return strategy.
Top Financial Highlights
- Total orders rose 87% to $23.0 billion, reflecting strong demand across commercial and defense customers.
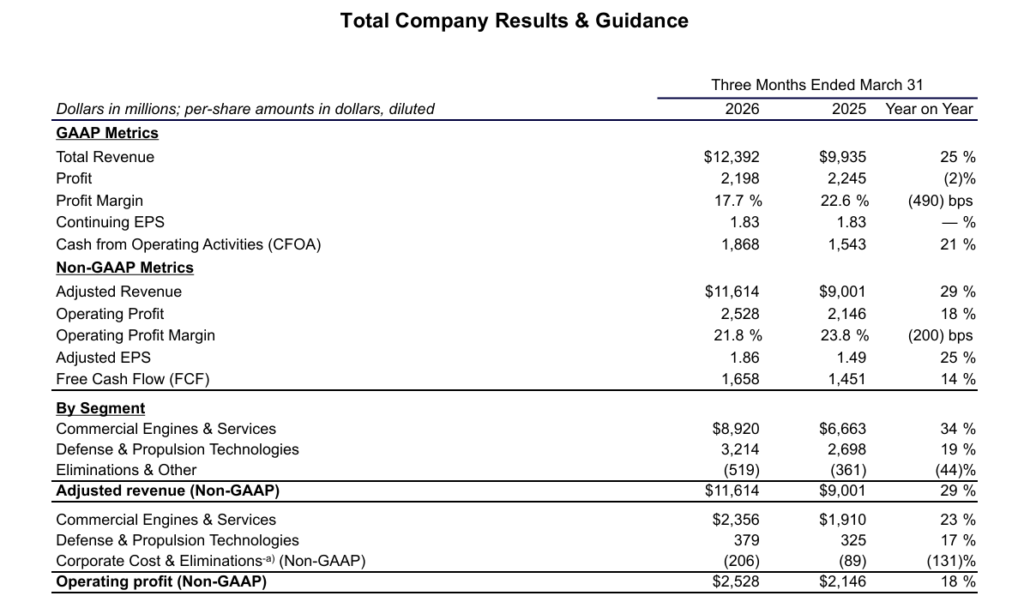
- Total revenue (GAAP) increased 25% to $12.4 billion; adjusted revenue grew 29% to $11.6 billion.
- GAAP profit was $2.2 billion, down 2% year on year as margin pressure offset volume growth.
- GAAP profit margin was 17.7%, down 490 basis points versus Q1 2025.
- Operating profit (non‑GAAP) was $2.5 billion, up 18%, with operating profit margin of 21.8%, down 200 basis points.
- Continuing EPS (GAAP) was $1.83, flat year on year; adjusted EPS rose 25% to $1.86.
- Cash from operating activities reached $1.9 billion, up 21%, while free cash flow was $1.7 billion, up 14%.
- Commercial Engines & Services (CES) revenue climbed 34% to $8.9 billion, with services revenue up 39% and total engine deliveries up 43%.
- CES operating profit rose 23% to $2.4 billion, though its margin contracted by 230 basis points to 26.4% due to mix and investments.
- Defense & Propulsion Technologies (DPT) revenue grew 19% to $3.2 billion, with operating profit up 17% to $379 million and margin at 11.8%.
- The commercial services backlog remained robust at about $170 billion, supporting medium‑term visibility.
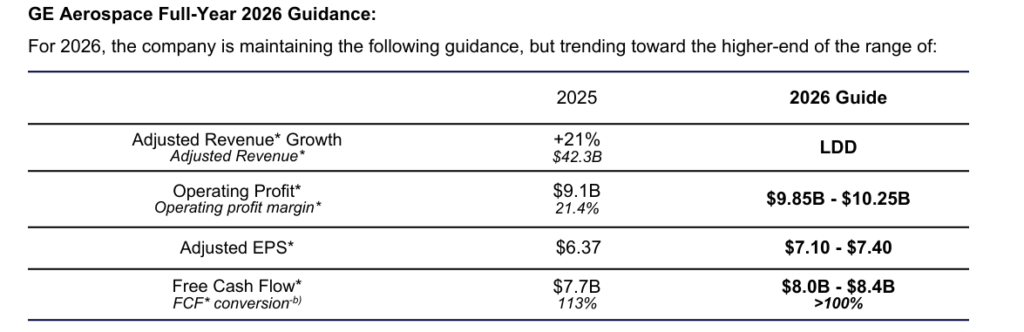
- Management maintained full‑year 2026 guidance, targeting adjusted EPS of $7.10–$7.40, operating profit of $9.85–$10.25 billion, and free cash flow of $8.0–$8.4 billion, trending toward the high end.
- 2026 guidance assumes elevated Brent crude prices through Q3, softer departures growth, and no global recession, highlighting macro risk to demand.
- Cash conversion remains strong, with 2025 free cash flow of $7.7 billion and expected 2026 FCF conversion above 100% of adjusted net income.
Beat or Miss?
Analyst consensus estimates referenced by market coverage indicate that GE Aerospace beat expectations on both revenue and adjusted EPS in Q1 2026. Where precise consensus numbers are not publicly broken out in the release, “Est.” values are based on cited external summaries.
Q1 2026 vs Expectations
| Metric | Reported | Difference / Analysis |
| Total revenue (GAAP) | $12.4 billion | Above consensus; external reports cite ~25% YoY revenue growth beating estimates. |
| Adjusted revenue | $11.6 billion | Roughly in line with or slightly above estimates; orders strength supports visibility. |
| GAAP EPS (continuing) | $1.83 | Flat YoY; consensus focus was on adjusted EPS, making this less of a driver. |
| Adjusted EPS | $1.86 | Beat vs cited consensus of about $1.60–$1.81, a solid upside surprise. |
| Free cash flow | $1.7 billion | Ahead of expectations according to multiple post‑earnings summaries. |
| 2026 adjusted EPS guide | $7.10–$7.40 | Reiterated; midpoint below some bullish analyst models, seen as conservative. |
| 2026 FCF guide | $8.0–$8.4 billion | Maintained; supports strong cash generation narrative. |
What Leadership Is Saying?
“GE Aerospace had a strong first quarter with orders growing 87% and revenue up 29% supporting double‑digit growth in earnings and free cash flow. FLIGHT DECK keeps us focused on what our customers value: driving improvements in output and durability, while reducing cost of ownership and applying today’s learnings to next‑generation technologies.” – H. Lawrence Culp, Jr., Chairman and CEO.
“Our young and diverse fleet coupled with a $170 billion commercial services backlog positions us well to navigate the current operating environment. With the dynamic geopolitical landscape, we’re holding our full‑year guidance across the board and are trending toward the high‑end of the range given our strong start to the year.” – H. Lawrence Culp, Jr., speaking to margins, guidance discipline, and macro risk;
Historical Performance (YoY, GE Aerospace)
Based on the Q1 2026 release, GE Aerospace provided comparable Q1 2025 figures that enable a simple year‑on‑year view.
Q1 2026 vs Q1 2025
| Category | Q1 2026 | Q1 2025 | Change (%) |
| Total revenue (GAAP) | $12.4 billion | $9.9 billion | 25% |
| Adjusted revenue | $11.6 billion | $9.0 billion | 29% |
| Profit (GAAP) | $2.2 billion | $2.2 billion | -2% |
| Operating profit | $2.5 billion | $2.1 billion | 18% |
| Operating margin | 21.80% | 23.80% | (200) bps |
| Operating expenses* | $9.4 billion (adjusted costs) | $7.2 billion | 31% |
Historical Performance – Key Competitors (YoY)
To contextualize GE Aerospace’s Q1 2026 performance, it is useful to compare with two major aerospace peers: RTX Corporation (formerly Raytheon Technologies) and Safran. The table below summarizes headline year‑on‑year trends for the most recent Q1 results available.
Q1 2026 vs Q1 2025 – Major Peers
| Company / Category | Q1 2026 | Q1 2025 | Change (%) |
| GE Aerospace – Revenue | $12.4 billion | $9.9 billion | 25% |
| GE Aerospace – Net income (GAAP, continuing)* | $1.9 billion | $2.0 billion | Roughly flat to slightly down |
| GE Aerospace – Operating expenses* | $9.4 billion (adjusted costs) | $7.2 billion | 31% |
| RTX – Revenue | $22.1 billion | $20.3 billion | +9% reported; about +10% organic. |
| RTX – Net income | $2.1 billion | $1.5 billion | 34% |
| RTX – Operating expenses** | Implied from margin; not fully broken out in release | N/A | N/A |
| Safran – Revenue (consensus for Q1 2026) | €8.28 billion (consensus) | N/A in same table | N/A in this source |
| Safran – Net income | N/A (Q1 typically not fully reported) | N/A | N/A |
| Safran – Operating expenses | N/A | N/A | N/A |
How the Market Reacted?
Despite delivering a solid beat on both revenue and adjusted EPS, GE Aerospace’s stock traded lower following the Q1 2026 release. Several outlets report that shares fell about 4–6%, with one citing a 5.56% decline to a close around $286-$287 on the day of the announcement. The negative reaction appears driven less by the quarter itself and more by investor concern over margin compression, higher oil and jet fuel prices, and a cautious traffic outlook that capped full‑year guidance at its prior range.
Overall sentiment in market commentary is still constructive on GE Aerospace’s long‑term fundamentals, given the large order book and services backlog, but near‑term positioning turned more defensive as traders focused on macro risks and the lack of an explicit guidance raise