


Introduction
Zendesk Statistics: Zendesk continues to be a significant force in the customer experience (CX) and helpdesk industry. Its development and progress provide important insights into the global transformation of digital support. The tools it offers enhance customer service for retailers, SaaS companies, and even governmental organizations.
Regardless of whether a business aims to expand its support capabilities or automate routine tasks, the statistics from Zendesk present a persuasive narrative. Delve into the complete article for comprehensive insights regarding usage, features, and market trends.
Editor’s Choice
- In January 2025, Zendesk’s website experienced a remarkable 90.04 million visits, marking its peak monthly traffic.
- The estimated market share is currently at 8.43%, indicating a significant portion of the overall market.
- Globally, in 2024, more than 158,360 companies began utilizing Zendesk as their Contact Center solution.
- Discord leads in driving Zendesk’s social media referrals, accounting for an impressive 50.23% of total traffic.
- In August 2025, Zendesk reported 141.71 million visits over three months.
- For the year 2024, Zendesk achieved approximately USD 1.93 billion in total revenue.
General Zendesk Statistics
- In January 2025, Zendesk’s website experienced a record 90.04 million visits, marking its peak monthly traffic.
- By February 2025, the number of monthly visits fell to 77.15 million, reflecting fluctuations in user engagement.
- The United States represents approximately 36.56% of Zendesk’s traffic share, the highest among all countries.
- Organic visits constitute 57.98% of Zendesk’s overall traffic, suggesting a robust interest driven by direct and brand recognition.
- Zendesk has set a goal to achieve USD 3.4 billion in revenue by 2025, an increase from roughly USD 1.93 billion.
- Approximately 73% of support agents feel that utilizing an AI copilot would enhance their job efficiency.
- Zendesk is utilized by 0.1% of all websites (among those with known CMS usage).
Zendesk Market Share Statistics
- The customer base is sizable at 183,388 current customers, indicating broad adoption.
- The estimated market share stands at 8.43%, reflecting a meaningful slice of the overall market.
- The product is positioned strongly at #2 in ranking, suggesting it is one of the top two players in its category.
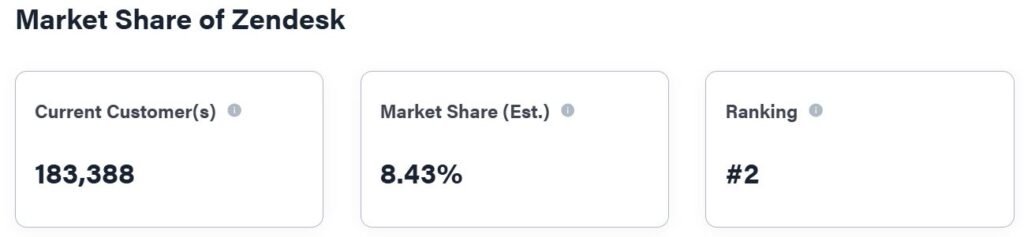
(Source: 6sense.com)
Zendesk User Demographics Statistics
- The gender distribution is almost equal, with 50.91% of users being male and 49.09% female.
- Young professionals are the predominant demographic, as the 25–34 age group constitutes the largest segment at 27.42%.
- Millennials and early Generation X individuals (ages 35–44) closely follow, representing 21.26% of Zendesk’s user population.
- Mid-career professionals aged 45–54 account for 17.31%, indicating significant adoption among established workforce demographics.
- Older users, specifically those aged 55–64, make up 11.88%, reflecting an increasing engagement from senior professionals.
- Users aged 65 and above represent 7.59%, suggesting that Zendesk’s influence reaches older business leaders and consultants.
- The overall demographic distribution underscores Zendesk’s equitable gender representation and its strong appeal to working-age adults (25–44), who are pivotal in driving customer support and customer experience innovation on a global scale.
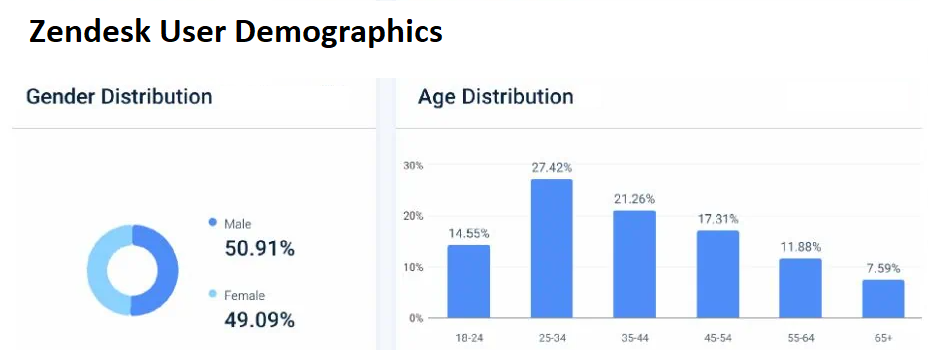
(Source: sqmagazine.co.uk)
Zendesk Usage Statistics
- Zendesk continues to be a leading entity in the customer service software industry, enjoying considerable popularity and extensive utilization.
- As per the most recent statistics, Zendesk caters to more than 99,000 businesses across 159 nations, overseeing 6.2 billion tickets and assisting 2.1 billion customers through the efforts of 1.6 million agents.
- Globally, in 2024, more than 158,360 companies have begun utilizing Zendesk as their Contact Center solution.
- Zendesk manages over 1 billion interactions each year, highlighting its capacity and dependability in addressing large volumes of customer inquiries.
Zendesk Benefits Statistics
- A 50% decrease in response times is achieved by automating initial interactions and efficiently routing tickets.
- A 30% enhancement in agent productivity results from the automation of repetitive tasks, enabling agents to concentrate on more complex issues.
- A 40% rise in customer satisfaction scores is noted due to quicker resolutions and support across multiple channels.
- A 20% decrease in operational costs is realized by reducing the necessity for additional support staff and streamlining workflows.
- The capacity to manage up to 5 times more support tickets is possible without a corresponding rise in staffing, ensuring scalability as the business expands.
- A 15% enhancement in decision-making is facilitated through comprehensive analytics and reporting on customer interactions and agent performance.
- A 35% rise in self-service usage is observed with an integrated knowledge base, which diminishes direct support requests and empowers customers to independently find solutions.
- A 25% rise in sales conversions is achieved through active engagement with leads through live chat.
Zendesk Alternatives Statistics
| Thena | Free plan: 10 users, 1000 tickets/month | B2B teams using multiple communication channels | AI agents, Slack-first, omni-channel | Steep learning curve, mobile app is weak |
| Zoho Desk | Starts at USD 14/user/month | SMBs and enterprises with custom SLAs | Feature-rich, good Zoho integrations | Steep learning curve, mobile app weak |
| Intercom | Starts at USD 29/seat/month | SaaS and e-commerce, large enterprises | Proactive support, productivity boost | Complex UI, high cost |
| Drag | Starts at USD 8/user/month | Support teams using Google Workspace | Gmail integration, visual boards | Email-only focus, clutter risk |
| HubSpot Service Hub | Starts at USD 15/user/month | Large businesses using HubSpot products | All-in-one, intuitive UI | Expensive, limited customization |
| Freshdesk | Starts at USD 15/agent/month | Organizations of all sizes | Omnichannel, customizable | May lag at high volumes |
| Help Scout | Starts at USD 50/month | SMBs scaling personalized support | Human-like support, great UI | Expensive, lacks advanced automation |
| Salesforce Service Cloud | Starts at USD 25/user/month | Large businesses using Salesforce | Salesforce integration, powerful CRM | High cost, complex setup |
| HappyFox | Starts at USD 9/agent/month | Startups to large enterprises | Automation, efficient ticketing | UI is less modern, with limited analytics |
| GrooveHQ | Starts at USD 6/user/month | Customer support in SMBs | Affordable, intuitive UI | Basic features, limited automation |
| Hiver | Starts at USD 15/user/month | All business sizes using Gmail | Gmail-based helpdesk, good integrations | Depends on Gmail, high ticket cost |
| Kustomer | Custom pricing | Mid-to-large enterprises | 360° view, timeline, smart automation | Expensive, complex setup |
| ServiceNow | Custom pricing | Large enterprises needing IT integration | Cross-department workflows | Steep learning curve |
| LiveAgent | Starts at USD 15/agent/month | Businesses of all sizes | Multichannel, affordable | Learning curve, limited customization |
Zendesk Social Media Traffic Statistics
- Discord leads in social media referrals for Zendesk, accounting for an impressive 50.23% of the overall traffic.
- YouTube comes in second place with 12.36%, showcasing significant engagement through video tutorials and product demonstrations.
- Reddit ranks third at 10.10%, fueled by community discussions and user support forums.
- LinkedIn represents 6.28%, underscoring Zendesk’s focus on its professional and B2B audience.
- WhatsApp WebApp contributes 5.71%, reflecting an increase in traffic from integrated chat and customer communication links.
- Other platforms collectively make up 15.32%, indicating Zendesk’s broad reach across smaller or emerging social networks.
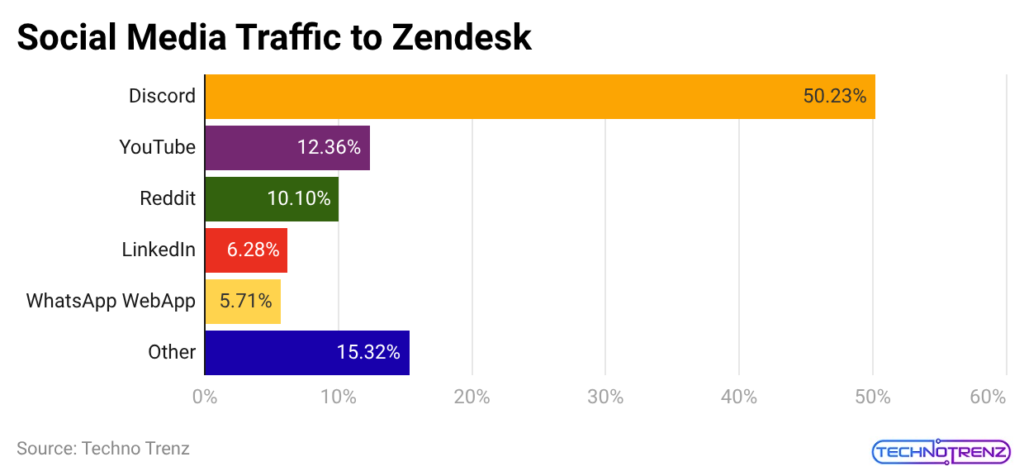
(Reference: sqmagazine.co.uk)
Zendesk Website Visits Statistics
- In January 2025, the number of site visits reached a peak of 90.04 million.
- Visits subsequently decreased to 77.15 million in February 2025.
- In December 2024, the visits totaled 83.93 million, reflecting growth as the year transitioned into 2025.
- In August 2025, Zendesk reported 141.71 million visits over three months.
- During the same timeframe, there was a month-on-month decline in traffic of 3.32%.
- The average session duration for that period was 14 minutes and 6 seconds.
- On average, there were 5.68 page views per visit.
- The bounce rate for that timeframe was recorded at 50.59%.
- Organic search traffic experienced a month-over-month increase of 10.09% during that period.
Zendesk Revenue By Region Statistics
- In 2024, Zendesk reported total revenue of approximately USD 1.93 billion.
- The company has established a goal to achieve USD 3.4 billion by the conclusion of 2025, which would nearly double its revenue from the 2024 figure.
- According to previous quarterly reports, the United States accounted for more than 51% of the revenue, with USD 162.39 million out of USD 318.22 million in Q2 2021.
- The EMEA region has consistently ranked as the second-largest contributor, providing 29% of revenue during the same Q2 2021 timeframe.
- In that period, the APAC region contributed 10%, indicating potential for further growth.
- Zendesk asserts that 50% of its revenue now originates from outside the United States, reflecting an expanding international presence.
- The company’s focus on enterprise contracts (valued at USD 250k or more) now accounts for 39% of its revenue, indicating a strategic shift towards larger global clients.
- Zendesk has reported 140 customers who are paying over USD 1 million annually, marking a 65% increase year-over-year; a significant number of these clients are based internationally.
Zendesk Competitors Statistics
- Wix is the clear market leader, holding 82.23% share with 1,788,107 domains, making it far ahead of every other competitor.
- Agile CRM and Freshworks are the next strongest alternatives, but their shares are much smaller at 1.89% and 1.67%.
- The remaining competitors are all below 1% share each, including Genesys PureCloud (0.62%), Salesforce Service Cloud (0.55%), Bitrix24 (0.45%), and Mitel (0.43%).
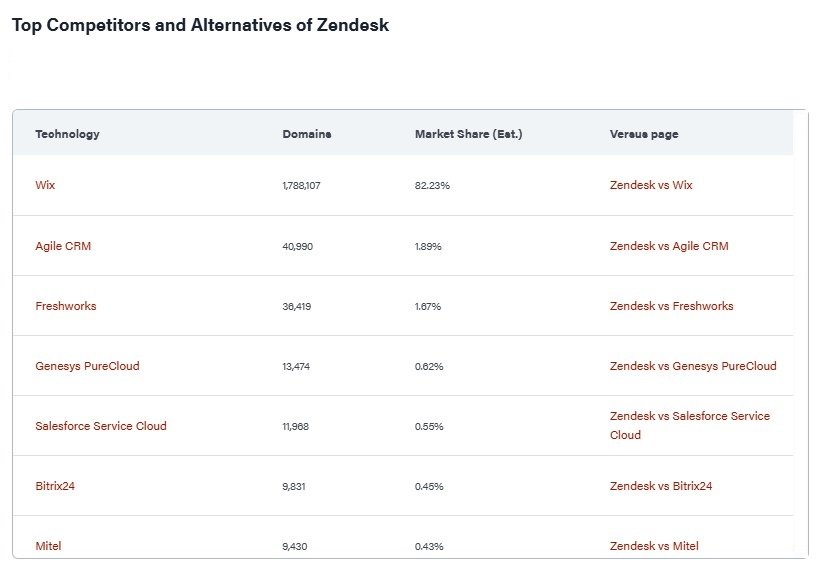
(Source: 6sense.com)
Zendesk AI and Automation Statistics
- An estimated 85% of customer interactions are anticipated to be managed without the involvement of a human agent.
- Currently, 56% of organizations have implemented AI-powered chatbots.
- Support driven by AI has the potential to lower costs by 30%.
- Within the next two years, 70% of customer experience leaders intend to incorporate generative AI across various touchpoints.
- A significant 59% of consumers believe that AI will fundamentally transform support interactions.
- AI tools have the capability to enhance productivity by as much as 66%, equating to 47 years of growth.
- 73% of support agents report that an AI copilot would enhance their effectiveness.
- Zendesk is making investments in autonomous service frameworks.
- AI routing and triage contribute to the optimization of agent workloads.
Zendesk Reporting and Analytics Statistics
- Zendesk Explore users have the capability to access real-time dashboards that display metrics such as ticket volume and SLA breaches for more than 20,000 organizations globally.
- The analytics provided by the platform monitor improvements in agent performance, demonstrating resolution rates that are up to 32% faster following the implementation of AI-guided insights.
- Analytics from the help center indicate over 15 million article views each month and facilitate the tracking of the most searched queries as well as abandoned searches for each workspace.
- A recent update has eliminated the “other” event category, resulting in an enhancement of AI reporting accuracy by nearly 18% within standard analytics.
- The 2025 iteration of Auto Assist now accommodates reporting segmentation for as many as 50 brands and includes link click actions within summaries.
- Zendesk has introduced anonymous user tracking, which captures engagement from as much as 40% of visitors to the help center who are not logged in.
- The scheduled report delivery feature automates the export of weekly and monthly reports in over 60 different global languages.
Zendesk Customers Statistics
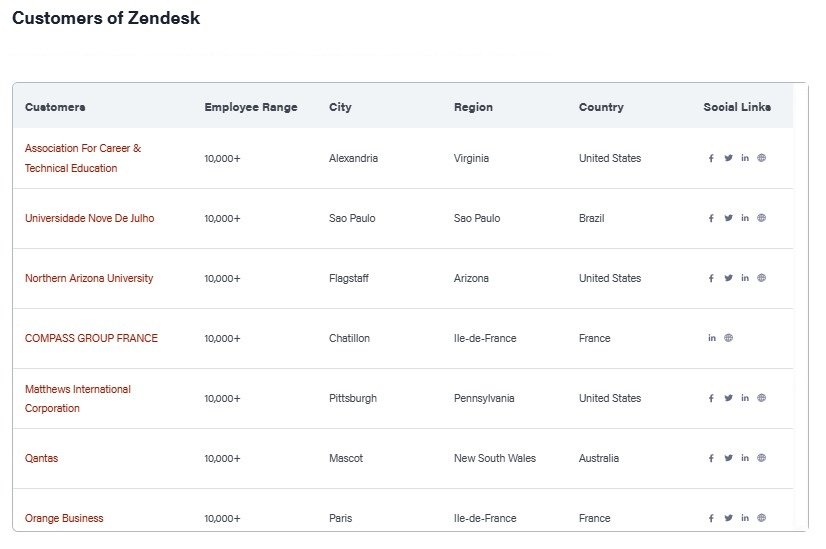
- In 2026, adoption is reported at over 182,763 companies using the tool as a contact center solution worldwide.
- The sample customer list shown is dominated by large enterprises, with each entry indicating an employee range of 10,000+.
- Customers span multiple continents, including North America, South America, Europe, and Australia.
- The United States appears multiple times (e.g., Alexandria, VA; Flagstaff, AZ; Pittsburgh, PA), suggesting strong penetration there.
- France is also represented more than once (e.g., Chatillon and Paris in Île-de-France), indicating a notable presence in that market.
- Brazil is represented via an organization based in São Paulo, showing traction in Latin America.
- Australia is represented by a major organization located in Mascot, New South Wales, indicating coverage in APAC.
(Source: 6sense.com)
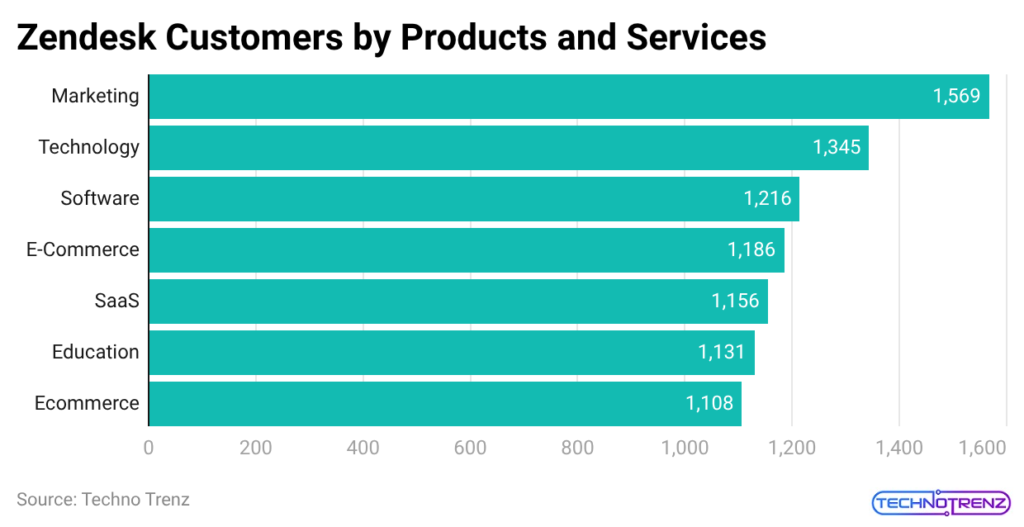
Zendesk Customers By Products and Services Statistics
- Marketing is the largest segment, with 1,569 customers.
- Technology ranks second at 1,345 customers, showing strong adoption among tech-focused organizations.
- Software is third with 1,216 customers, closely aligned with the technology customer base.
- E‑Commerce (listed as “E‑Commerce”) accounts for 1,186 customers, indicating heavy use in online retail/support operations.
- SaaS follows with 1,156 customers, reinforcing adoption among subscription-based service providers.
- Education shows a meaningful presence at 1,131 customers.
- Another Ecommerce category appears separately at 1,108 customers, suggesting the data may split the same industry into two labels (potential taxonomy/normalization issue).
(Reference: 6sense.com)
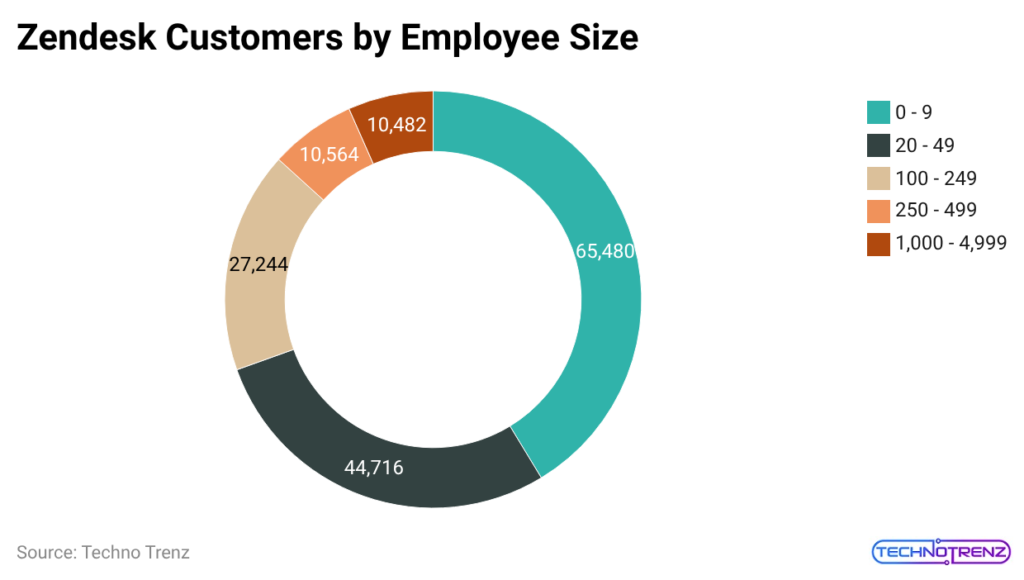
Zendesk Customers By Employee Size Statistics
- The largest share of customers comes from very small companies with 0–9 employees (65,480 companies).
- The next biggest segment is 20–49 employees (44,716 companies), reinforcing strong adoption in the small-business market.
- Mid-sized organizations of 100–249 employees form a significant third group with 27,244 companies.
- Companies with 10–19 employees represent a comparatively small portion of the customer base versus the leading segments.
- The 250–499 employee segment is also relatively small, indicating weaker penetration in the upper mid-market compared with SMB.
(Reference: 6sense.com)
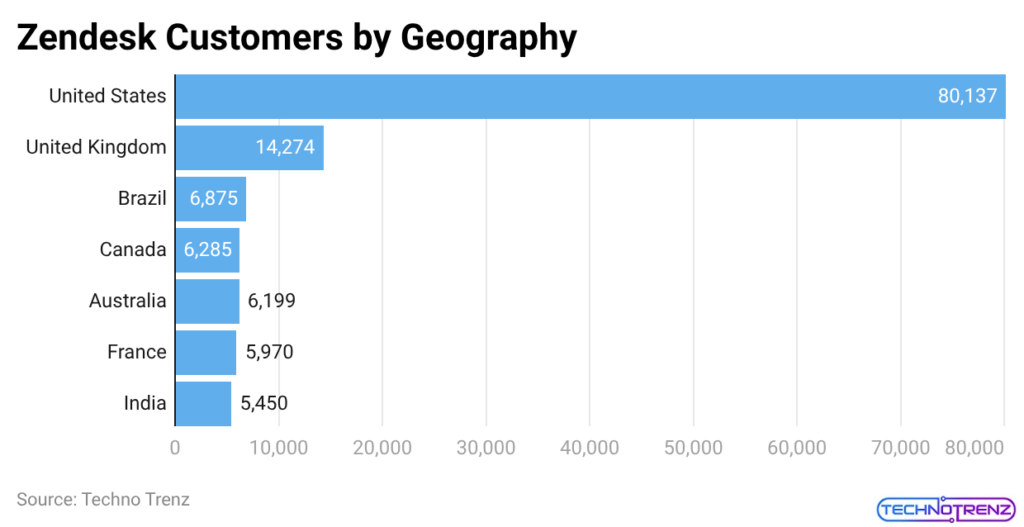
Zendesk Customers By Geography Statistics
- The United States is the dominant geography with 80,137 customers (57.21%), accounting for well over half of the total.
- The United Kingdom is a distant second with 14,274 customers (10.19%).
- Brazil ranks third at 6,875 customers (4.91%), less than half of the UK total.
- The top three countries (the US, the UK, and Brazil) collectively represent 72.31% of customers, indicating strong concentration in a few markets.
- After the top three, there’s a tight cluster of countries with similar customer counts: Canada (6,285), Australia (6,189), France (5,970), and India (5,450).
- The US customer count is roughly 5.6× the UK and about 11.7× Brazil, showing a steep drop-off after the top market.
- Canada and Australia are nearly tied, separated by only 96 customers, suggesting comparable penetration in those two markets.
(Reference: 6sense.com)
Zendesk Recent Development Statistics
- During Relate 2025, Zendesk unveiled plans aimed at decreasing response times and enhancing system precision.
- The company’s expansion into new markets, especially in the APAC region, seeks to foster growth beyond its primary U.S. operations. The APAC region represents 10% of the global business.
- Additionally, the organization has commenced strategic layoffs, affecting 51 positions in San Francisco, to better allocate resources towards key projects.
Conclusion
Zendesk has progressed significantly from being merely a helpdesk tool. Its reporting and analytics capabilities, enhanced by Explore, facilitate data-driven decision-making. The integration of AI and automation is further transforming support dynamics towards quicker, self-service interactions.
Satisfaction metrics indicate that users demand promptness and contextual assistance, and any shortcomings in these areas could lead to customer attrition. Ultimately, Zendesk’s extensive usage and market presence confirm its status as a preferred option for small, medium, and even large enterprises.
FAQ
Zendesk is an AI-driven cloud platform primarily designed for customer service, helpdesk assistance, and sales monitoring. It aggregates inquiries from email, chat, phone, and social media into a unified workspace, allowing businesses to effectively manage, track, and resolve customer concerns.
Indeed, Zendesk functions as a CRM (Customer Relationship Management) system. Although it was originally recognized solely for customer support, it has evolved into a comprehensive suite of products that includes both service and sales functionalities.
Yes, Zendesk has evolved into an AI-first customer service platform. It incorporates an integrated intelligence layer that automates customer interactions and supports agents with generative tools.