


Amerant Bancorp Inc. reported Q1 2026 net income of $17.9 million and diluted EPS of $0.44, with total revenue (net interest income plus noninterest income) of about $97.7 million, slightly below several external revenue expectations while EPS was roughly in line with consensus. After-hours movement was not disclosed in the company release; market reaction will depend on views of margin pressure versus sharply lower expenses.
About Amerant Bancorp Inc.
Amerant Bancorp Inc. (NYSE: AMTB) is a bank holding company headquartered in Coral Gables, Florida, originally founded in 1979. It operates primarily through Amerant Bank, N.A. and Amerant Investments, Inc., offering deposit, credit, and wealth management services to individuals and businesses. The bank has operated for over 45 years and maintains a network of 23 banking centers, including 21 in South Florida and 2 in Tampa, Florida.
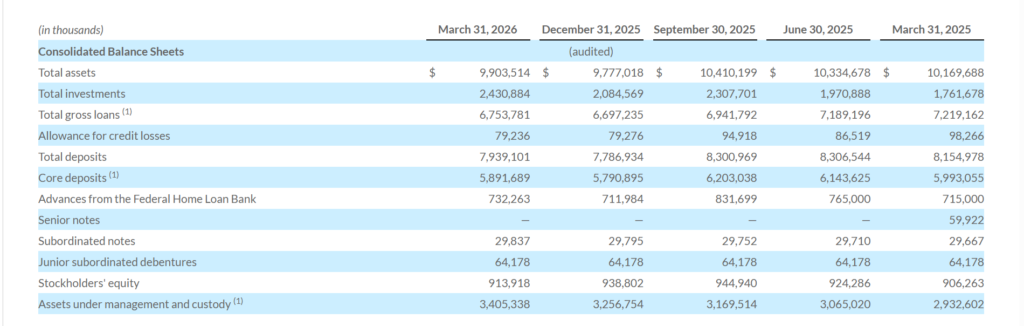
As of March 31, 2026, Amerant reported total assets of $9.9 billion, total deposits of $7.9 billion, and assets under management and custody of $3.4 billion. The company’s stockholders’ equity stood at $913.9 million, with tangible common equity ratio of 9.02% and an efficiency ratio of 68.52% for the quarter.
Amerant declared a quarterly cash dividend of $0.09 per share and has been actively repurchasing stock, buying back about 859,000 Class A shares in Q1 2026. While the precise current market cap and P/E ratio are not provided in the release, the balance sheet and profitability metrics indicate a mid-cap regional bank profile.
Top Financial Highlights
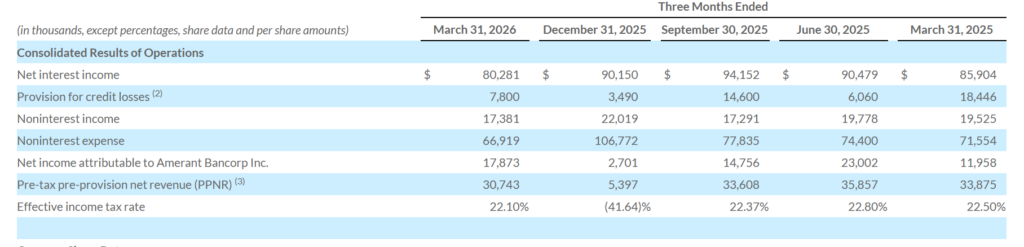
- Net income attributable to Amerant Bancorp Inc. was $17.9 million in Q1 2026, up sharply from $2.7 million in Q4 2025.
- Diluted EPS was $0.44 in Q1 2026, compared with $0.07 in Q4 2025 and $0.28 in Q1 2025.
- Total revenue (net interest income plus noninterest income) was approximately $97.7 million ($80.3 million net interest income and $17.4 million noninterest income).
- Net interest income (NII) declined to $80.3 million, down 11.0% from $90.2 million in Q4 2025, reflecting lower net interest margin and changes in earning-asset mix.
- Net interest margin (NIM) was 3.55%, down from 3.78% in Q4 2025 and 3.75% in Q1 2025, as funding costs remained elevated relative to asset yields.
- Provision for credit losses rose to $7.8 million, up from $3.5 million in Q4 2025, driven by portfolio actions and credit migration.
- Noninterest income was $17.4 million, down 21.1% from $22.0 million in Q4 2025, reflecting the absence of large one-time gains recorded in the prior quarter.
- Noninterest expense fell sharply to $66.9 million, down 37.3% from $106.8 million in Q4 2025, supported by vendor savings and the lack of prior quarter restructuring and loss items.
- Pre-tax pre-provision net revenue (PPNR) increased to $30.7 million, from $5.4 million in Q4 2025, highlighting improved underlying profitability.
- Total assets ended the quarter at $9.9 billion, up 1.3% from $9.8 billion at December 31, 2025.
- Total gross loans were $6.8 billion, up 0.8% quarter-over-quarter, as Amerant continued to optimize and rebalance its loan portfolio.
- Total deposits reached $7.9 billion, up 2.0%, with core deposits increasing 1.7% to $5.9 billion, supported by growth in lower-cost international deposits.
- Cash and cash equivalents declined to $188.7 million, down 59.9% from $470.2 million, while investment securities grew 16.6% to $2.4 billion.
- Total non-performing assets stood at $191.6 million, representing 1.93% of total assets, with non-performing loans of $176.1 million and OREO of $15.5 million.
- Assets under management and custody increased to $3.4 billion, up 4.6% from $3.3 billion in the prior quarter.
Beat or Miss?
| Metric | Reported (Q1 2026) | Estimated / Expected | Difference / Analysis |
| Revenue (total, approx.) | $97.7 million | $100.7–$102.6 million (various external estimates) | Revenue missed consensus by roughly $3–$5 million, reflecting softer NII and lower noninterest income. |
| EPS (diluted) | $0.44 | $0.43–$0.44 (consensus range) | EPS was in line to slightly above expectations, aided by lower expenses and improved PPNR. |
| Net interest margin | 3.55% | N/A | NIM declined sequentially, indicating continued pressure from funding costs and asset yield dynamics. |
| Net income | $17.9 million | N/A | Net income improved strongly versus Q4 2025, driven by lower noninterest expense despite higher provision. |
What Leadership Is Saying?
“Amerant’s first quarter results reflect continued momentum in executing our strategic plan as we strengthen credit quality and position the bank for sustainable, long-term growth. During the quarter, we demonstrated proactive credit risk management, which led to balanced portfolio actions. We also continued to optimize our loan portfolio, including exiting certain large-exposure, out-of-footprint and criticized loans. In addition, we’ve maintained our focus on operational efficiency, delivering net income in line with our guidance, primarily driven by better than expected cost-savings and strong growth in lower-cost international deposits.”
– Carlos Iafigliola, SEVP and Interim CEO
“We are keenly focused on the long-term health of the business and demonstrating our ongoing commitment to stability and predictability. With strong fundamentals, a clear path forward, and a highly capable team, we are confident in our ability to deliver sustainable value for our customers, communities, and shareholders.”
– Carlos Iafigliola, SEVP and Interim CEO (also speaking to strategic and financial positioning)
Historical Performance (YoY Company View)
Using Q1 2026 versus Q1 2025 figures from the selected financial information tables:
| Category | Q1 2026 | Q1 2025 | Change (%) |
| Revenue (NII + noninterest income) | $97.7 million (NII $80.3m + noninterest $17.4m) marketscreener | $105.4 million (NII $85.9m + noninterest $19.5m) marketscreener | -7.3% (lower NII and noninterest income) |
| Net income attributable to Amerant | $17.9 million | $12.0 million | +49.5% (benefit from lower noninterest expense and lower loss items) |
| Noninterest expense (proxy for operating expenses) | $66.9 million | $71.6 million | -6.5% (cost savings and absence of prior restructuring items) |
How the Market Reacted?
The Amerant Q1 2026 release does not include explicit intra-day or after-hours stock price movement data. External earnings-flash coverage indicates that the stock recently traded around $24.00, with modest positive performance over the prior five days and year-to-date gains above 20%, reflecting generally constructive sentiment toward the name.
Revenue came in below consensus, but EPS met or slightly exceeded expectations, supported by a strong improvement in PPNR and a much lower expense base. Overall, the tone of the report and management commentary is more constructive than negative, with investors likely to weigh credit-quality risks and lower NIM against visible cost discipline and capital returns via dividends and buybacks.