


CarMax reported Q1 FY2026 EPS of $1.38, up more than 40% year over year, on revenue of $7.55 billion, up about 6% and modestly ahead of expectations. The stock initially traded higher in pre‑market by just over 3%, reflecting a positive reaction to the earnings beat and strong margin performance.
About CarMax
CarMax, Inc. (NYSE: KMX) is the largest retailer of used vehicles in the United States, operating an omni‑channel platform that lets customers buy and sell cars both online and in-store. Headquartered in Richmond, Virginia, the company was founded in 1993 and has grown to about 250 store locations and over 30,000 associates nationwide.
In fiscal 2025, CarMax sold approximately 790,000 used vehicles and 540,000 wholesale vehicles, while its CarMax Auto Finance (CAF) arm originated more than $8 billion in auto loans and managed a nearly $18 billion loan portfolio. As of the Q1 FY2026 release, CarMax’s market cap is in the mid‑single‑digit billions of dollars, and the stock trades on the NYSE with no regular dividend, reflecting a growth‑oriented capital allocation strategy focused on share repurchases and reinvestment.
Top Financial Highlights
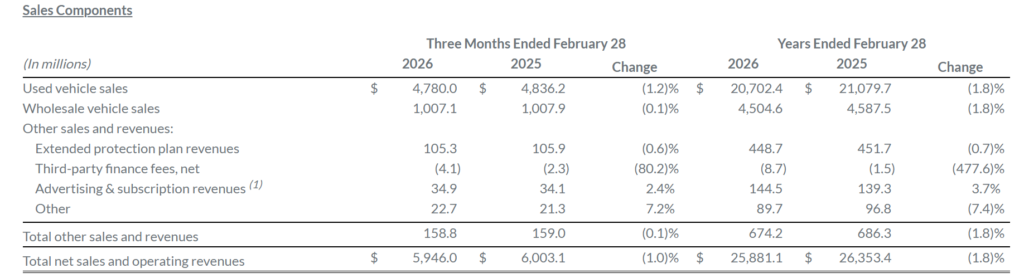
- Total net sales and operating revenues rose to $7.55 billion, up about 6% year over year.
- Net earnings increased to $210.4 million, compared with $152.4 million a year earlier.
- Diluted EPS climbed 42.3% to $1.38 from $0.97 in Q1 FY2025.
- Total gross profit grew 12.8% to $893.6 million, driven by higher unit volumes and strong unit margins.
- Retail used vehicle gross profit reached $554.2 million, with record gross profit per used unit of $2,407, up $60 per unit.
- Wholesale vehicle gross profit was $156.6 million, with historically strong gross profit per unit of $1,047 despite a slight year‑over‑year decline.
- Other gross profit, including service and extended protection plans (EPP), rose 31.3% to $182.8 million, supported by cost efficiencies and EPP growth.
- CarMax Auto Finance income declined 3.6% to $141.7 million, pressured by a higher provision for loan losses of $101.7 million.
- SG&A expenses increased 3.3% to $659.6 million, but SG&A as a percentage of gross profit improved sharply to 73.8% from 80.6%.
- Retail used unit sales rose 9.0% to 230,210, with comparable store used unit sales up 8.1%.
- Wholesale unit sales increased 1.2% to 149,517, while wholesale revenues dipped 0.3% due to lower average selling prices.
- Digital capabilities supported 80% of retail unit sales; omni‑channel transactions were 66% and fully online retail sales represented 14% of retail units.
- Cash, cash equivalents, and restricted cash ended the quarter at roughly $989 million, providing solid liquidity.
- Net cash provided by operating activities was about $300 million, compared with a use of cash in the prior‑year period.
- The company repurchased 3.0 million shares for $199.8 million, with $1.74 billion remaining under its authorization.
Beat or Miss?
Q1 FY2026 Performance vs Expectations
| Metric | Reported | Difference/Analysis |
| Revenue | $7.55 billion | Slight beat vs ~$7.54 billion consensus; ~6% YoY growth. |
| Diluted EPS | $1.38 | Beat vs ~$1.19 consensus; ~16% positive surprise, >40% YoY growth. |
| Total gross profit | $893.6 million | Up 12.8% YoY, reflecting stronger unit volumes and margins. |
| Net earnings | $210.4 million | Up from $152.4 million; benefited from operating leverage. |
| CAF income | $141.7 million | Down 3.6% YoY due to higher loss provisions despite healthy interest margin. |
What Leadership Is Saying?
“We delivered our fourth consecutive quarter of positive retail comps and double-digit year-over-year earnings per share growth. These results highlight the strength of our earnings growth model, which is underpinned by our best-in-class omni-channel experience, the diversity of our business, and our sharp focus on execution.” – Bill Nash, president and chief executive officer.
“SG&A as a percent of gross profit improved by 680 basis points to 73.8% in the first quarter compared to 80.6% in the prior year’s first quarter, driven by the growth in gross profit and ongoing cost management efforts in the stores and customer experience centers.” – Commentary from management on operating expense discipline and margin leverage.
Historical Performance
YoY Comparison: Q1 FY2026 vs Q1 FY2025
| Category | Q1 FY2026 | Q1 FY2025 | Change (%) |
| Revenue | $7.55 billion | $7.11 billion | ≈ +6.1% |
| Net earnings | $210.4 million | $152.4 million | ≈ +38.0% |
| Diluted EPS | $1.38 | $0.97 | 42.30% |
| Total gross profit | $893.6 million | $791.9 million | 12.80% |
| SG&A expenses | $659.6 million | $638.6 million | +3.3%, slower than gross profit |
| CAF income | $141.7 million | $147.0 million | −3.6% |
Key Competitor Snapshots (YoY EPS/Revenue Trend)
| Category | CarMax Q1 FY2026 | Select Peer Q3 FY2026* | Change vs Prior‑Year Quarter |
| Revenue | $7.55 billion, +6% YoY | $5.8 billion, −6.9% YoY (peer snapshot) | CarMax growing; peer facing sales decline. |
| Net earnings/EPS | EPS $1.38, +42.3% YoY | EPS $0.43, down from $0.81 YoY | CarMax expanding earnings vs peer contraction. |
| Gross profit | $893.6 million, +12.8% YoY | $590 million, −13% YoY | CarMax margin dollars rising; peer margins compressing |
How the Market Reacted?
Following the Q1 FY2026 report, CarMax shares moved higher in pre‑market trading, rising about 3.2% as investors reacted to the EPS beat and solid revenue and gross profit growth. The positive price action suggests a bullish near‑term sentiment, driven by strong retail unit growth, record per‑unit margins, and improved SG&A leverage.
At the same time, some caution persists around CAF credit performance and provisioning trends, which management is addressing through adjustments to its non‑prime funding program. Investors will watch upcoming quarters closely to see if CarMax can sustain double‑digit EPS growth while managing finance‑segment risks and macro uncertainty in used‑vehicle demand.