


Allstate (NYSE: ALL) delivered a standout Q1 2026 with adjusted EPS of $10.65, crushing the consensus estimate of $7.36 by 44.7%. Total revenues reached $16.94 billion, a 3% year-over-year gain. Net income surged to $2.4 billion versus $566 million in the prior year. The stock traded near $212.33 on earnings day (April 29) and climbed to $217.26 on April 30, reflecting a positive after-hours and next-day market reaction.
About The Allstate Corporation
The Allstate Corporation (NYSE: ALL), headquartered in Northbrook, Illinois, is one of the largest publicly held personal lines property and casualty insurers in the United States. Founded in 1931 and widely recognized by its iconic slogan “You’re in Good Hands with Allstate,” the company offers auto, home, life, and commercial insurance products, identity protection, and roadside assistance services distributed through Allstate agents, independent agents, major retailers, and direct digital channels.
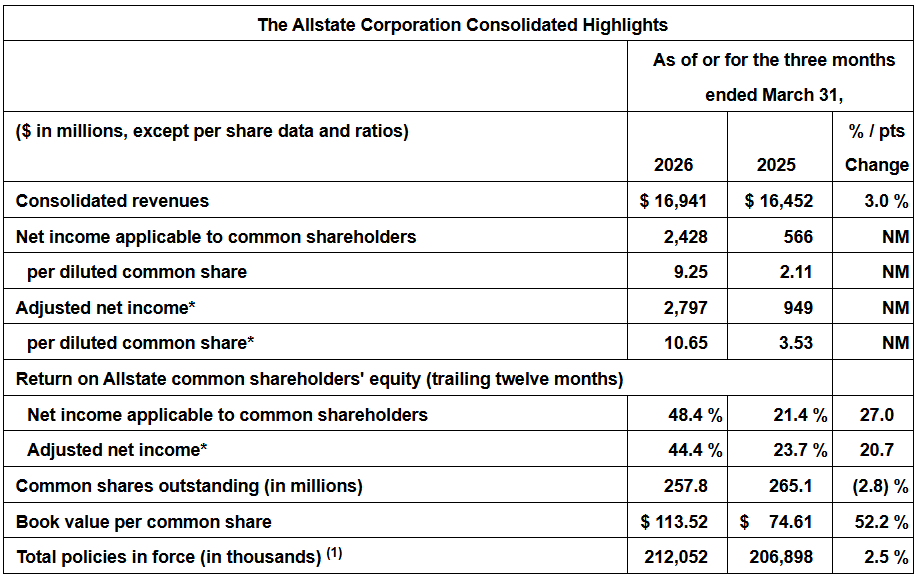
As of May 2026, Allstate carries a market capitalization of approximately $55.75 billion. The company reported 212 million policies in force as of Q1 2026, and book value per common share stood at $113.52, a 52.2% increase year over year. Allstate’s adjusted net income return on equity (trailing twelve months) reached 44.4%, with 258 million shares outstanding and $881 million returned to shareholders through dividends and buybacks in the quarter.
Top Financial Highlights
- Total revenues reached $16.94 billion, up $489 million or 3.0% year over year
- Net income applicable to common shareholders was $2.428 billion, vs. $566 million in Q1 2025
- GAAP diluted EPS was $9.25, compared to $2.11 in the prior year quarter
- Adjusted net income (non-GAAP) was $2.797 billion, or $10.65 per diluted share, vs. $3.53 in Q1 2025
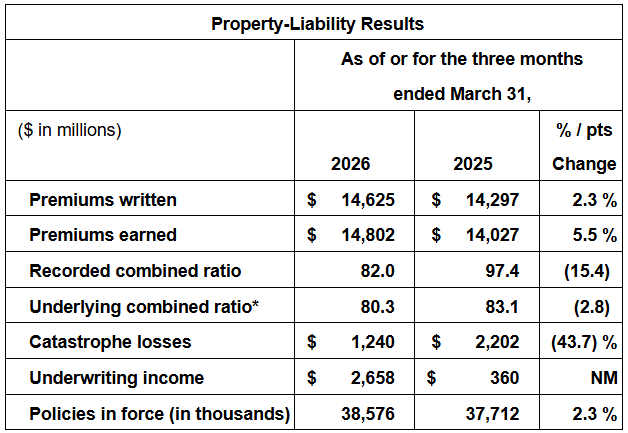
- Property-Liability earned premiums rose 5.5% to $14.8 billion; underwriting income was $2.658 billion vs. $360 million in Q1 2025
- Property-Liability recorded combined ratio improved 15.4 points to 82.0
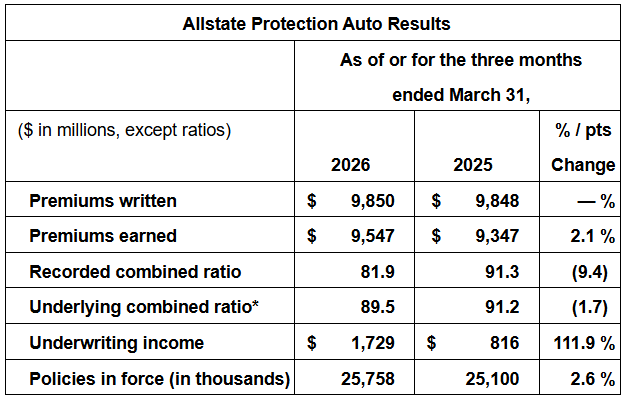
- Allstate Protection Auto earned premiums grew 2.1% to $9.547 billion; underwriting income more than doubled to $1.729 billion
- Allstate Protection Homeowners earned premiums surged 13.9% to $4.164 billion; underwriting swung to a profit of $685 million from a loss of $451 million in Q1 2025
- Catastrophe losses dropped 43.7% to $1.24 billion from $2.202 billion in Q1 2025
- Net investment income increased 9.8% to $938 million
- Protection Services revenues climbed 7.2% to $922 million; Protection Plans revenue grew 13.5% to $613 million
- Total investment portfolio stood at $85.2 billion
- Book value per common share was $113.52, a 52.2% increase year over year
- Policies in force reached 212 million, up 2.5% year over year
Beat or Miss?
| Metric | Reported | Estimated | Difference / Analysis |
| Adjusted EPS (Non-GAAP) | $10.65 | $7.36 | Beat by $3.29 (+44.7%) |
| Total Revenue | $16.94 billion | $16.84 billion | Beat by ~$100M (+0.6%) |
| Net Premiums Earned | $15.55 billion | $14.99 billion | Beat by 3.8% |
| Pre-Tax Profit | $3.108 billion | N/A | 18.3% pre-tax margin |
| Book Value Per Share | $113.52 | $118.77 | Missed by 4.4% |
| Combined Ratio (P&L) | 82 | N/A | 15.4 pts better vs. Q1 2025 |
What Leadership Is Saying?
“Allstate’s strategy and execution capabilities generated strong earnings and increased growth in the first quarter. Revenues were $16.9 billion and net income was $2.4 billion. Policies in force reached 212 million, reflecting increased growth in auto and homeowners insurance and Protection Plans. Market share of auto and homeowners insurance increased in many states due to a comprehensive approach of more affordable prices, new products, expanded benefits, bundled offerings, lower expenses, sophisticated analytics and increased marketing.”
Tom Wilson, Chairman and CEO
“Allstate’s active capital management continues to create shareholder value. Operating results generated an adjusted net income return on equity of 44.4% over the last year. Increased capital was deployed to investment opportunities, and $881 million of cash was provided to shareholders through dividends and share repurchases.”
John Dugenske, Interim CFO and President, Investments and Corporate Strategy
Historical Performance (Allstate YoY)
| Category | Q1 2026 | Q1 2025 | Change (%) |
| Total Revenues | $16,941M | $16,452M | +3.0% |
| Net Income (common shareholders) | $2,428M | $566M | +329% |
| Adjusted Net Income | $2,797M | $949M | +194.7% |
| Adjusted EPS (Diluted) | $10.65 | $3.53 | +201.7% |
| P&L Earned Premiums | $14,802M | $14,027M | +5.5% |
| P&L Combined Ratio | 82 | 97.4 | -15.4 pts |
| Catastrophe Losses | $1,240M | $2,202M | -43.7% |
| Net Investment Income | $938M | $854M | +9.8% |
| Book Value Per Common Share | $113.52 | $74.61 | 52.20% |
Competitor Comparison (Q1 2026 vs. Q1 2025)
| Company | Metric | Q1 2026 | Q1 2025 | Change (%) |
| Allstate (ALL) | Total Revenue | $16.94B | $16.45B | +3.0% |
| Allstate (ALL) | Net Income | $2.43B | $0.57B | +329% |
| Allstate (ALL) | Combined Ratio | 82 | 97.4 | -15.4 pts |
| Progressive (PGR) | Total Revenue | $22.19B | ~$20.40B | +8.7% |
| Progressive (PGR) | Net Income | $2.82B | $2.57B | +10% |
| Progressive (PGR) | Combined Ratio | 86.4 | 86 | +0.4 pts |
| Travelers (TRV) | Total Revenue | $11.92B | $11.81B | +1.0% |
| Travelers (TRV) | Net Income | $1.71B | $0.40B | +332% |
| Travelers (TRV) | Combined Ratio | 88.6 | 102.5 | -13.9 pts |
All three insurers benefited from sharply lower catastrophe losses in Q1 2026 compared to Q1 2025, which was heavily impacted by the January 2025 California wildfires. Among peers, Allstate posted the strongest combined ratio improvement and the largest EPS beat relative to analyst estimates. Progressive led in absolute revenue and premium volume, while Travelers showed similar net income recovery patterns.
How the Market Reacted?
Allstate shares closed at $212.33 on April 29, 2026, the day of the earnings release (after market close), down about 1.88% from the prior session’s open as pre-announcement positioning weighed on the stock. The following day, April 30, shares recovered strongly, rising 2.32% to close at $217.26, as investors responded positively to the 44.7% EPS beat and the dramatic swing in underwriting profitability.
By May 1, 2026, the stock was trading near $216.59, and analyst sentiment remained broadly constructive, with a consensus “Moderate Buy” rating and an average price target of approximately $240.56. Piper Sandler maintained a Buy rating on May 1, 2026, with a target of $268, while Wall Street Zen moved to a Hold, reflecting a mixed but broadly positive analyst backdrop.