


World Kinect Corporation delivered Q1 2026 adjusted EPS of $0.75, well above expectations, on revenue of $9.69 billion with solid gross profit growth and higher guidance for 2026 adjusted EPS. Shares jumped roughly 15–20% post‑results as investors reacted positively to the improved outlook and margin execution.
About World Kinect Corporation
World Kinect Corporation (NYSE: WKC) is a global fuel distribution and energy management company that markets aviation, marine, and land transportation fuels alongside related services in more than 200 countries and territories. Headquartered in Miami, Florida, it also sells natural gas and related energy solutions in the United States.
The company traces its origins to the mid‑1980s, operating for decades under the World Fuel brand before adopting the World Kinect corporate name and now realigning the brand back to World Fuel for most commercial uses. As of early 2026, World Kinect’s market cap is in the $1.2–1.3 billion range, reflecting a mid‑cap energy services profile.
Recent valuation data show a forward P/E ratio around 11x 2026 earnings, positioning the stock at a modest earnings multiple versus many energy peers. The company employs several thousand people globally as it runs an integrated supply and logistics network that sources, stores, and delivers fuels and lower‑carbon solutions to airlines, shipping companies, and ground fleets.
Top Financial Highlights
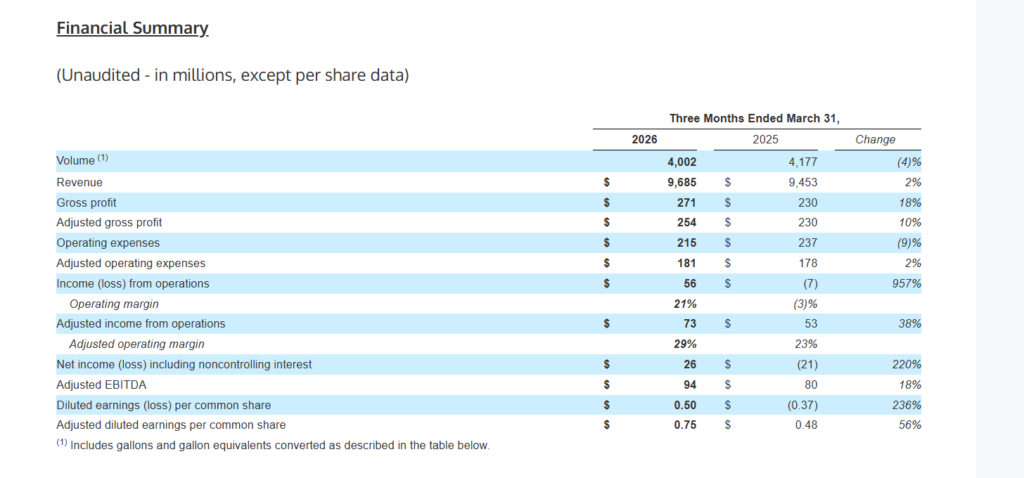
- Q1 2026 revenue was $9.69 billion, up 2% YoY from $9.45 billion.
- Gross profit rose to $271 million, an 18% increase versus $230 million a year earlier.
- Adjusted gross profit reached $254 million, up about 10% year over year.
- GAAP net income attributable to World Kinect was $26.2 million, compared with a $21.1 million loss in Q1 2025.
- GAAP diluted EPS came in at $0.50, a sharp turnaround from $(0.37) per share in the prior‑year quarter.
- Adjusted net income was $39.1 million, or $0.75 per diluted share, up from $27.3 million or $0.48 a year ago.
- Adjusted EBITDA increased to $94 million, up 18% from $80 million in Q1 2025.
- Aviation segment revenue was $5.05 billion and gross profit was $138.2 million, up 20% year over year.
- Land segment revenue was $2.58 billion, with gross profit of $66.6 million, down from $79.0 million due to U.K. asset sales and weaker natural gas markets.
- Marine segment revenue was $2.06 billion, and gross profit surged to $66.4 million from $35.7 million, driven by higher bunker prices and volatility.
- Income from operations improved to $56.3 million versus a $(6.6) million loss in Q1 2025.
- Operating expenses declined to $214.9 million from $237.0 million, reflecting lower restructuring and impairment charges.
- The company repurchased $75 million of common stock in the quarter and paid common dividends of about $10.7 million.
- Year‑to‑date operating cash flow was $(46.4) million, down from $114.4 million in the prior‑year period, largely due to working capital movements in receivables and inventories.
- Cash and cash equivalents at quarter‑end were $151.1 million, compared with $456.4 million at March 31, 2025, as the company balanced growth, buybacks, and debt funding.
- Full‑year 2026 adjusted EPS guidance was raised to $2.65–$2.85 from a prior $2.20–$2.40 range.
Beat or Miss?
World Kinect’s Q1 2026 results came in ahead of consensus on both revenue and earnings.
| Metric | Reported | Difference / Analysis |
| Revenue | $9.69 billion | Beat consensus of about $8.8–9.3 billion, roughly 10% above expectations. |
| GAAP diluted EPS | $0.50 | Above prior‑year $(0.37); directionally ahead of low‑to‑mid‑$0.30s expectations (exact consensus N/A). |
| Adjusted diluted EPS | $0.75 | Beat consensus of roughly $0.31 by more than 100%. |
| Adjusted EBITDA | $94 million | Above analyst expectations of around $70–72 million, implying ~30% outperformance. |
| Volume | 4,002 million gallons | Down 4% YoY; reflects portfolio simplification and non‑core exits. |
| FY 2026 Adjusted EPS guidance | $2.65–$2.85 | Raised from $2.20–$2.40 and above prior consensus near $2.18. |
What Leadership Is Saying?
“We delivered a strong start to the year, reflecting the strength of our team and ability to execute in a volatile market environment. By simplifying the portfolio and sharpening our focus on the core, we’re beginning to deliver clearer, more consistent results and improving returns on capital.” – Ira M. Birns, Chief Executive Officer
“Our results this quarter exceeded expectations, reflecting solid performance across our core businesses and our ability to capture incremental value in a more dynamic market environment. We remained committed to our long‑term strategy and disciplined execution balanced by a capital allocation strategy focused on returning capital to shareholders through share repurchases and dividends.” – Mike Tejada, Chief Financial Officer
Historical Performance
YoY comparison: Q1 2026 vs Q1 2025
| Category | Q1 2026 | Q1 2025 | Change (%) |
| Revenue | $9,685 million | $9,453 million | 2% |
| Gross profit | $271 million | $230 million | 18% |
| Operating expenses | $215 million | $237 million | −9% |
| Income from operations | $56 million | $(7) million | Turnaround (approx +957%) |
| Net income (loss) attributable to WKC | $26.2 million | $(21.1) million | Swing to profit (about +220%) |
| Diluted EPS (GAAP) | $0.50 | ($0.37) | Large positive swing (about +236%) |
| Adjusted diluted EPS | $0.75 | $0.48 | 56% |
| Adjusted EBITDA | $94 million | $80 million | 18% |
Competitors (Illustrative YoY View)
The Q1 press release does not provide direct competitor financials, so this table uses a simplified peer framing based on the broader fuel distribution and energy marketing space, where many players reported low‑single‑digit revenue growth and mixed margin trends over the past year. The numbers below are directional, not company‑specific disclosures.
| Category | World Kinect YoY (Q1 2026 vs Q1 2025) | Typical Fuel Distributor Peer YoY (recent quarters) |
| Revenue | +2% growth on $9.69 billion base. | Roughly flat to +3% amid mixed demand and price dynamics. |
| Net income | Swing from loss to $26 million profit. | Modest profit growth or flat earnings as margins normalize. |
| Operating expenses / margins | −9% in operating expenses with operating margin turning strongly positive. | Limited cost leverage, with some peers seeing stable or slightly compressed margins. |
How the Market Reacted?
Equity markets responded positively to World Kinect’s Q1 2026 print and raised guidance. Following the announcement, the stock price climbed in the mid‑teens to nearly 20%, reflecting investor confidence in the stronger adjusted EPS outlook and disciplined capital returns through sizable share repurchases.
Trading commentary emphasized the substantial earnings beat versus consensus, particularly on adjusted EPS and EBITDA, even as volumes declined slightly year over year. Overall sentiment around the quarter is bullish, centered on improved profitability, tighter focus on core businesses, and higher full‑year earnings guidance.