


X Financial posted Q4 2025 total net revenue of US$209.9 million (RMB1.47B), down 14.1% year-over-year, missing the growth trend seen earlier in 2025. Basic EPS per ADS came in at RMB1.44 (US$0.21), an 82.5% YoY drop. Full-year revenue hit US$1.09 billion, up 30.1%. Pre-market stock fell approximately 10.82% after the results were released.
About X Financial
X Financial (NYSE: XYF) is a leading Chinese fintech platform headquartered in Shenzhen, China. Founded in 2015, the company connects individual borrowers with institutional funding partners through proprietary big data technology and risk assessment tools. Its core products include Xiaoying Credit Loans (online personal unsecured products, including card loans), Xiaoying Housing Loans (secured home equity products), as well as guarantee, consulting, and microcredit services.
As of late March 2026, XYF trades on the New York Stock Exchange with a market capitalization of approximately US$148.82 million, reflecting a sharp drawdown from the 52-week high of US$20.36. The stock carries a trailing P/E ratio of 0.72 and a dividend yield of approximately 16.43%. The company pays dividends semi-annually, with the most recent declared dividend of US$0.28 per ADS payable on or about May 20, 2026. X Financial employs a capital-light model under which loans are largely facilitated and originated on behalf of institutional funding partners, rather than held on its own balance sheet.
Top Financial Highlights
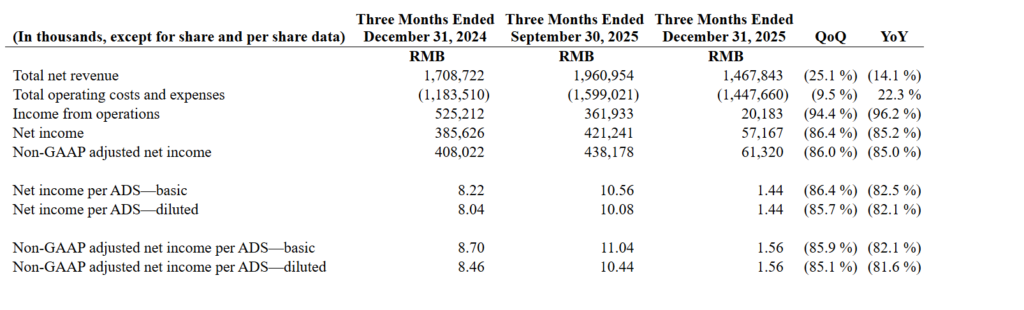
- Q4 2025 total net revenue was RMB1,467.8 million (US$209.9 million), down 14.1% year-over-year and 25.1% quarter-over-quarter
- Full year 2025 total net revenue reached RMB7,639.4 million (US$1,092.4 million), an increase of 30.1% from 2024
- Q4 2025 net income was RMB57.2 million (US$8.2 million), a steep decline of 85.2% year-over-year
- Full year 2025 net income totaled RMB1,464.6 million (US$209.4 million), compared to RMB1,539.9 million in 2024 – a modest 4.9% decrease
- Q4 2025 non-GAAP adjusted net income was RMB61.3 million, compared to RMB408.0 million in Q4 2024
- Basic EPS per ADS in Q4 2025 was RMB1.44 (down 82.5% YoY); non-GAAP adjusted EPS per ADS was RMB1.56
- Q4 2025 income from operations collapsed to RMB20.2 million, down 96.2% year-over-year
- Q4 2025 operating margin fell to 1.4%, compared to 18.5% in Q3 2025 and 30.7% in Q4 2024
- Total loan amount facilitated and originated in Q4 2025 was RMB22,768 million, down 29.5% YoY and 32.3% QoQ
- Full year 2025 total loan facilitation reached RMB130,552 million, up 24.5% from RMB104,889 million in 2024
- 31-60 day delinquency rate rose to 2.90% (from 1.17% a year earlier), signaling notable credit quality deterioration
- 91-180 day delinquency rate increased to 4.31% (from 2.28% a year prior)
- Active borrowers in Q4 2025 fell to approximately 1.69 million, down 20.2% from a year ago
- Semi-annual dividend declared at US$0.28 per ADS, payable on or about May 20, 2026
- Q1 2026 loan origination guidance set at RMB14.5 billion to RMB15.5 billion, reflecting a cautious stance
Fourth Quarter 2025 GAAP and Non-GAAP Financial Summary
Beat or Miss?
The table below uses sequential (QoQ) and year-over-year benchmarks as performance reference points.
| Metric | Reported (Q4 2025) | Prior Quarter (Q3 2025) | Q4 2024 | Difference / Analysis |
| Total Net Revenue | RMB1,467.8M (US$209.9M) | RMB1,960.9M | RMB1,708.7M | Down 25.1% QoQ, down 14.1% YoY |
| Net Income | RMB57.2M (US$8.2M) | RMB421.2M | RMB385.6M | Down 86.4% QoQ, down 85.2% YoY |
| Non-GAAP Adjusted Net Income | RMB61.3M | RMB438.2M | RMB408.0M | Down 86.0% QoQ, down 85.0% YoY |
| Basic EPS per ADS | RMB1.44 | RMB10.56 | RMB8.22 | Down 86.4% QoQ, down 82.5% YoY |
| Income from Operations | RMB20.2M | RMB361.9M | RMB525.2M | Down 94.4% QoQ, down 96.2% YoY |
| Operating Margin | 1.40% | 18.50% | 30.70% | Severe compression from provisions surge |
| Loan Originations | RMB22,768M | RMB33,639M | RMB32,293M | Down 32.3% QoQ, down 29.5% YoY |
What Leadership Is Saying?
“In the fourth quarter of 2025, we facilitated and originated RMB22.8 billion in loans, a decline of 32.3% from the prior quarter and 29.5% year-over-year. Borrower activity moderated further, with active borrowers declining to approximately 1.69 million, down 20.2% from a year ago, reflecting the Company’s deliberate focus on higher-quality origination and tighter credit standards across our core channels.” – Mr. Kent Li, President of X Financial
“In the fourth quarter of 2025, total net revenue was RMB1.47 billion, a decrease of 14.1% from the same period last year and 25.1% sequentially. Net income was RMB57.2 million and non-GAAP adjusted net income was RMB61.3 million, both significantly lower than the prior quarter, primarily due to substantially higher provisions and lower loan facilitation revenue amid reduced origination volumes. Operating margin declined to 1.4%, compared with 18.5% in the prior quarter and 30.7% in the same period last year, mainly driven by higher provisioning and reduced contribution from higher-margin facilitation services. ” – Mr. Frank Fuya Zheng, Chief Financial Officer of X Financial
Historical Performance
Year-over-year comparison of Q4 2025 versus Q4 2024:
| Category | Q4 2025 | Q4 2024 | Change (%) |
| Total Net Revenue | RMB1,467.8M | RMB1,708.7M | -14.10% |
| Net Income | RMB57.2M | RMB385.6M | -85.20% |
| Non-GAAP Adjusted Net Income | RMB61.3M | RMB408.0M | -85.00% |
| Income from Operations | RMB20.2M | RMB525.2M | -96.20% |
| Total Operating Costs and Expenses | RMB1,447.7M | RMB1,183.5M | 22.30% |
| Basic EPS per ADS | RMB1.44 | RMB8.22 | -82.50% |
| Loan Amount Facilitated | RMB22,768M | RMB32,293M | -29.50% |
| Active Borrowers | ~1.69 million | ~2.12 million | -20.20% |
Full fiscal year comparison (FY2025 vs FY2024)
| Category | FY 2025 | FY 2024 | Change (%) |
| Total Net Revenue | RMB7,639.4M | RMB5,871.8M | 30.10% |
| Net Income | RMB1,464.6M | RMB1,539.9M | -4.90% |
| Loan Amount Facilitated | RMB130,552M | RMB104,889M | 24.50% |
Competitor Landscape (Q4 2025)
Comparative Q4 2025 performance of key Chinese fintech peers:
| Company | Ticker | Q4 2025 Revenue | Q4 2024 Revenue | YoY Change | Q4 2025 Net Income | Q4 2024 Net Income | Net Income Change |
| X Financial | XYF | RMB1,467.8M | RMB1,708.7M | -14.10% | RMB57.2M | RMB385.6M | -85.20% |
| QFIN (Qifu Technology) | QFIN | RMB4,092.7M | RMB4,482.3M | -8.70% | RMB1,019.6M | RMB1,916.6M | -46.80% |
| LexinFintech | LX | RMB3,043M | RMB3,659M | -16.80% | RMB214M | N/A | N/A |
Full year 2025 comparison:
| Company | FY 2025 Revenue | FY 2024 Revenue | YoY Change | FY 2025 Net Income | FY 2024 Net Income | NI Change |
| X Financial (XYF) | RMB7,639.4M | RMB5,871.8M | 30.10% | RMB1,464.6M | RMB1,539.9M | -4.90% |
| QFIN (Qifu Technology) | RMB19,205.1M | RMB17,165.7M | 11.90% | RMB5,989.7M | RMB6,264.3M | -4.40% |
| LexinFintech (LX) | RMB13,152M | RMB14,198M | -7.40% | RMB1,700M | RMB1,115M | 52.40% |
Among the three peers, X Financial demonstrated the highest full-year revenue growth at 30.1%, but suffered the most severe Q4 profitability compression. QFIN maintained the largest absolute revenue and profit base but also saw net income contract, while LexinFintech showed the best full-year profit growth despite lower revenues.
How the Market Reacted?
X Financial’s stock opened sharply lower following the Q4 2025 release, with pre-market prices dropping approximately 10.82% as investors reacted to the steep earnings miss. Shares closed at US$3.42 on March 26, 2026, a single-day decline of 25.97% compared to the prior close. The stock touched a new one-month low of US$3.39 and was down over 36% on a three-month basis as of late March 2026.
The sentiment reflects a broadly bearish read on the elevated credit provisions, deteriorating delinquency rates, and sharply reduced loan origination guidance of RMB14.5 to RMB15.5 billion for Q1 2026, a significant pullback from the RMB35 billion facilitated in Q1 2025. An investor law firm also announced an investigation into X Financial executives in connection with the Q4 results, adding further pressure to the stock.