


Introduction
Mazda Statistics: Mazda Motor Corporation enters 2025–2026 navigating a dynamic automotive landscape shaped by electrification, global trade pressures, and shifting consumer demand toward SUVs and hybrids. TMazda leverages its premium market positioning and efficient SKYACTIV technology to maintain a competitive edge despite macroeconomic headwinds. Mazda demonstrates dedication to profitability through its product development efforts and the creation of strategic partnerships, together with financial and operational success, which results in maintained profitability and stability for the business operations.
Mazda achieves permanent growth in the changing global automotive market because of strong customer demand in North America and Japan, and its increased spending on hybrid and electric vehicle technologies. Through this article, we will examine the major Mazda statistics and its financial performance in the market.
Editor’s Choice
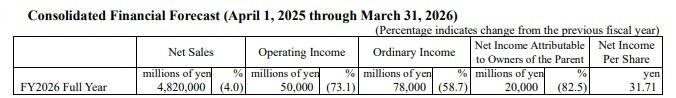
- Mazda projects FY2026 net sales at ¥4.82 trillion, reflecting a 4.0% YoY decline.
- Operating income is expected to drop 73.1% to ¥50 billion, indicating severe margin pressure.
- Core earnings weakness shows through the ordinary income forecast, which will decrease 58.7% to ¥78 billion.
- Net income is projected at ¥20 billion, down 82.5%, signaling a sharp profitability contraction.
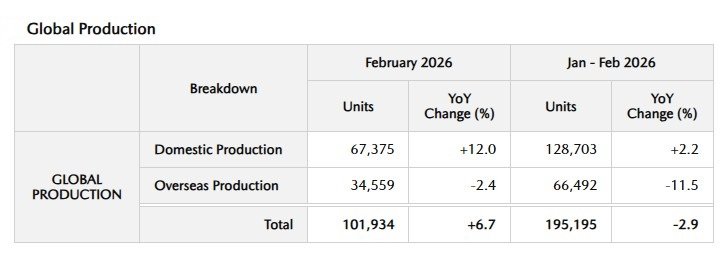
- Global production reached 101,934 units in February 2026, up 6.7% YoY.
- Japan production rose 12% to 67,375 units, strengthening domestic manufacturing contribution.
- Overseas production declined 2.4% to 34,559 units, reflecting global demand challenges.
- The production total for January and February 2026 decreased by 2.9% from the previous year to 195195 units.
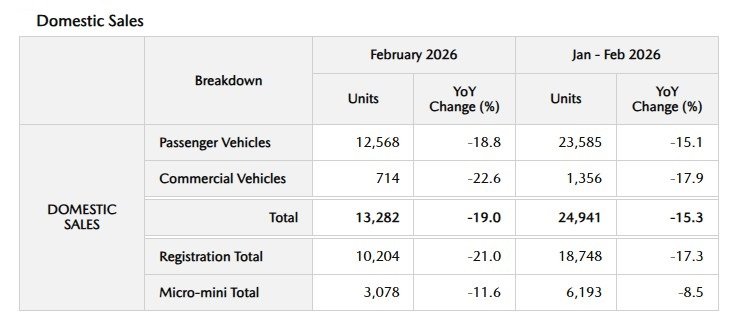
- February 2026 domestic sales decreased by 19% from the previous year to 13282 units.
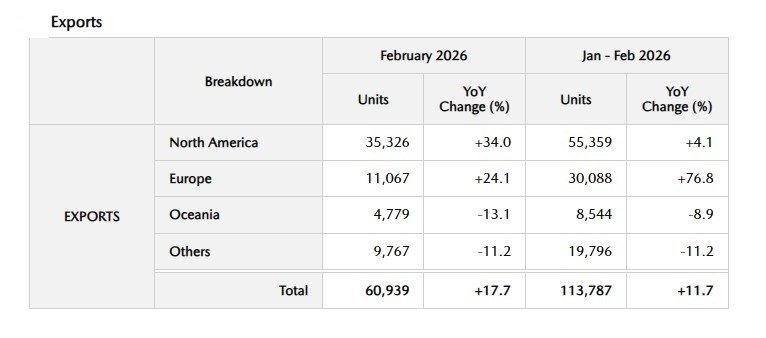
- Strong global demand for SUVs led to a 17.7% year-over-year increase in exports, which reached 60939 units.
- North America exports experienced a 34.0% increase, which became the primary factor driving market expansion.
- Global sales declined 9.1% YoY to 92,993 units in February 2026.
- The operating cash flow changed from a positive balance of ¥305.6B to a negative balance of -¥171.7B, which showed that the company experienced issues with maintaining cash availability.
- The free cash flow decreased from positive ¥105.7B to negative ¥145.8B.
Mazda Motor Corporation FY2026 Financial Outlook
(Source: mazda.com)
- The financial predictions that Mazda made for their consolidated operations during fiscal year 2026 show that their business currently experiences decreasing profits, although they can maintain their basic revenue streams.
- The company projects that net sales will reach ¥4.82 trillion, which represents a 4.0% decrease from the previous year because demand remains stable, yet the company faces challenges from pricing pressure, currency fluctuations, and global market normalization (Mazda Financial Forecast).
- The operating income will decrease to ¥50 billion, which represents a 73.1% YoY drop and creates major margin difficulties for the business.
- The company will experience rising expenses because of input costs and investments in electrification, and increasing research and development costs, which will support hybrid and EV development.
- The ordinary income will decrease to ¥78 billion, which represents a 58.7% drop, and this decrease confirms the ongoing decrease in earnings from main business activities.
- The net income for owners will total ¥20 billion, which represents an 82.5% drop, while the earnings per share will reach ¥31.71.
- The results indicate that the company will experience a temporary decrease in profitability because it invests in electrification, supply chain modifications, and competitive pricing in its main markets.
- Mazda aims to implement a long-term business transformation strategy instead of pursuing immediate financial benefits through profit maximization.
- The decreasing income results might worry investors, but they showed that the company needs to invest capital in developing next-generation mobility technologies, which include hybrid and electric vehicle platforms.
- Mazda’s FY2026 outlook signals revenue stability but profitability contraction, positioning the company in an investment-heavy phase that could yield margin recovery post-2027 as electrification scales and cost efficiencies materialize.
Mazda Global Production
(Source: newsroom.mazda.com)
- Mazda’s latest global production statistics for February 2026 showed two separate production paths because domestic production strength needs international markets to grow.
- The company reported total global production of 101,934 units in February 2026, which showed a production increase of 6.7% when compared to the same month last year.
- The Company Production Report shows that the company operations experienced a temporary improvement through this production increase.
- The domestic production report shows that Japan produced 67375 units, which represents a 12% growth compared to the previous year. This production increase demonstrates greater operational capacity at local factories, which now receive better semiconductor supplies and experience steady domestic market requirements.
- The international production figures dropped to 34559 units, which shows a 2.4% decrease compared to the previous year because international markets face ongoing problems with demand recovery, rising expenses, and regional supply chain changes.
- The first two months of 2026 showed total worldwide production of 195195 units, which represents a 2.9% decrease compared to the previous year because production during this time showed uneven growth patterns.
- The domestic production for this period reached 128703 units, which showed a 2.2% increase, while international production decreased by 11.5% to 66492 units, which showed structural problems for the company outside of Japan.
- The production data from Mazda shows that SUV model production continues to drive strong growth for the company.
- The Mazda CX-5 provides the base for domestic production with 26673 units, which shows a 6.5% increase from the previous year.
- The Mazda3 experienced an 18.4% increase, while the Mazda CX-30 saw a 48 % rise, which indicates increasing interest in compact crossover vehicles. The CX-50 experienced an 11.5% growth in international markets, which compensated for the 17.1% reduction in CX-30 production.
Mazda Motor Corporation Domestic Sales
(Source: newsroom.mazda.com)
- Mazda experienced a February 2026 domestic sales decline, which shows reduced consumer demand for major vehicle types.
- The domestic sales reached 13282 units, which represents a 19 % decrease compared to the previous year.
- The January–February total reached 24941 units, which represents a 15.3% year-on-year decrease and shows an ongoing decline in Japan’s automotive market (Mazda Official Data).
- The main source of revenue for the business experienced a major decrease, with passenger vehicle sales dropping to 12568 units, which represents an 18.8% decline.
- The commercial vehicle market experienced an even bigger drop, with sales decreasing to 714 units, which represents a 22.6% decline.
- Model-level data presents a mixed picture. The Mazda CX-5 maintained its sales volume at 2713 units, which represents a 0.9% increase.
- The Mazda2 experienced a drop in sales of 2.8% while the Mazda CX-30 saw a significant 22.1% decline, which indicates decreased demand for compact SUVs.
- The data shows that demand has entered a correction period, which requires Mazda to depend on its primary SUV vehicles for operational stability during difficult times in its home market (Mazda Reports).
Mazda Motor Corporation Export Performance
(Source: newsroom.mazda.com)
- Mazda’s export performance in February 2026 shows a strong recovery through Western market sales.
- Total exports reached 60,939 units, which represented a 17.7% Year-over-Year increase, while the January–February cumulative exports reached 113,787 units, which represented an 11.7% increase to demonstrate ongoing worldwide demand (Mazda Official Data).
- North America served as the primary regional growth driver because its export volume increased to 35,326 units, which represented a 34.0% increase through strong SUV sales and increasing price advantages.
- Europe showed even greater expansion because its volume increased by 24.1% during February, while year-to-date growth reached 76.8%, which brought the total to 30,088 units. This shows Mazda’s growing market share in this area.
- Oceania saw a market downturn, which reached 13.1%, while other markets experienced an 11.2% drop, which indicates that the worldwide recovery process remains inconsistent.
- The Mazda CX-5 remained the top contributor with 25,072 units (+4.9%) while the Mazda3 posted a strong +31.9% increase and the Mazda CX-30 surged +62.7% YoY, which showed that worldwide demand for compact crossovers grew at an accelerating rate.
Mazda Global Regional Sales
(Source: newsroom.mazda.com)
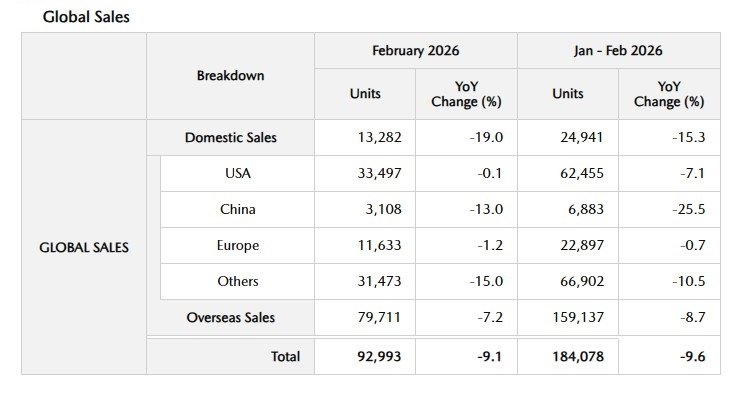
- The global sales results from February 2026 show that Mazda experienced a major decrease in demand from essential markets.
- The global sales total reached 92,993 units, which represents a 9.1% decrease from the previous year, and the overall sales volume reached 184,078 units, which shows a 9.6% decrease from the previous year.
- The data from Mazda’s official sources indicates that the company continues to face challenges in maintaining its sales volume.
- The domestic market experienced a significant drop, with sales decreasing by 19.0% compared to the previous year, which showed the existing market weakness in Japan.
- The overseas market experienced a sales decline of 7.2%, which showed a decrease in worldwide market demand.
- The U.S. market maintained sales at 33,497 units with only a minor decrease of 0.1%, but the total sales reached 33,497 units, which showed a 7.1% sales decline.
- The Chinese market continues to show poor performance with a 13.0% decrease in monthly sales and a 25.5% decrease in year-to-date sales, which demonstrate ongoing fundamental market difficulties.
- Europe displayed market strength with only a 1.2% decline, while other markets experienced a 15.0% drop, which demonstrates how widespread economic challenges affected their performance.
- The Mazda CX-5 achieved sales of 27,519 units, which represents a 7.0% increase that confirms its position as a major product for international sales.
- The Mazda CX-30 experienced a sales decline of 14.3% while the Mazda3 experienced an 8.0% decrease, which shows that the compact market segments face market difficulties.
- The period of transformation for Mazda presents complete challenges, which include decreasing sales, varying market demand, and solid performance from SUV models.
- The core SUV models maintain their strength, which creates a stabilizing effect for Mazda despite the declining sales volume.
- The company will achieve a recovery when global market demand shows improvement, according to the reports from Mazda and the analysis of market conditions.
Mazda Motor Corporation Cash Flow Dynamics, Balance Sheet Shifts and Strategic Signals
(Source: mazda.com)
- The financial results of Mazda Motor Corporation display an uneven assessment but provide important insights about its strategic objectives between the period of FY March 2025 and the first three quarters of FY March 2026.
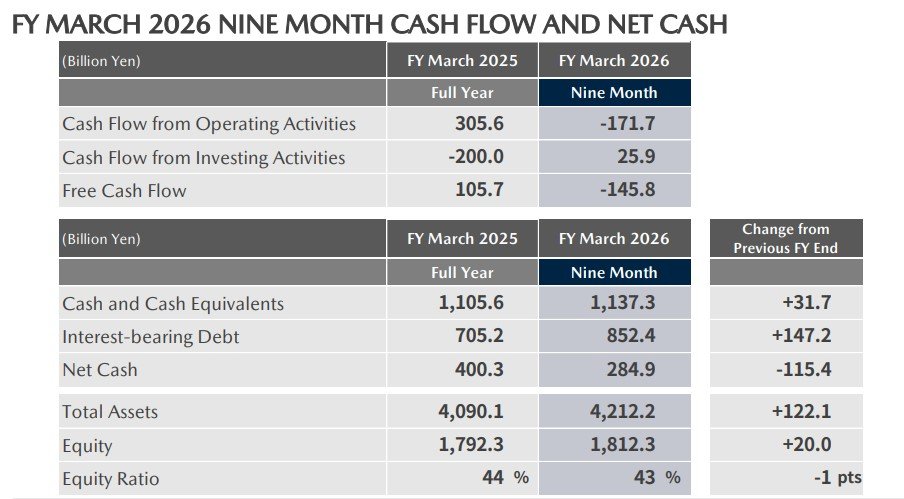
- The analysis of cash flow demonstrates that operating cash flow experienced a complete cash flow reversal, which dropped from a robust cash flow of ¥305.6 billion to a negative cash flow of -¥171.7 billion.
- The cash flow from investing operations showed a major improvement when it changed from -¥200.0 billion to +¥25.9 billion. (Source: Mazda Financial Reports).
- The resulting free cash flow (FCF) deteriorated from ¥105.7 billion to -¥145.8 billion, a critical metric for investors tracking liquidity strength and cash generation efficiency.
- Negative FCF usually creates worries about financial stability, but this situation actually shows that the company is undergoing short-term changes, which will lead to future growth instead of facing permanent financial problems.
- The balance sheet shows an increase in cash and cash equivalents, which grew by ¥31.7 billion to reach a total of ¥1,137.3 billion. This growth retains a strong liquidity position for the organization.
- The company experienced an increase in interest-bearing debt, which rose by ¥147.2 billion to reach a total of ¥852.4 billion. This growth caused net cash to decrease from ¥400.3 billion to ¥284.9 billion. Total assets increased by ¥122.1 billion and reached a value of ¥4,212.2 billion. The equity base grew by ¥20.0 billion to a total of ¥1,812.3 billion. This growth brought about a small decrease in the equity ratio, which declined from 44% to 43%.
- The bank’s balance sheet shows a minor deterioration because of balance sheet dilution. The bank needs to focus on improving its capital structure.
- The financial situation of Mazda shows that the company faces temporary cash flow problems while it increases its financial debt, but maintains its current rate of asset development.
Mazda Dividend Per Share
(Source: mazda.com)
Mazda Motor Corporation’s dividend history reflects a cyclical yet resilient shareholder return strategy that aligns its dividend payments with both its earnings fluctuations and the overall performance of the automotive sector.
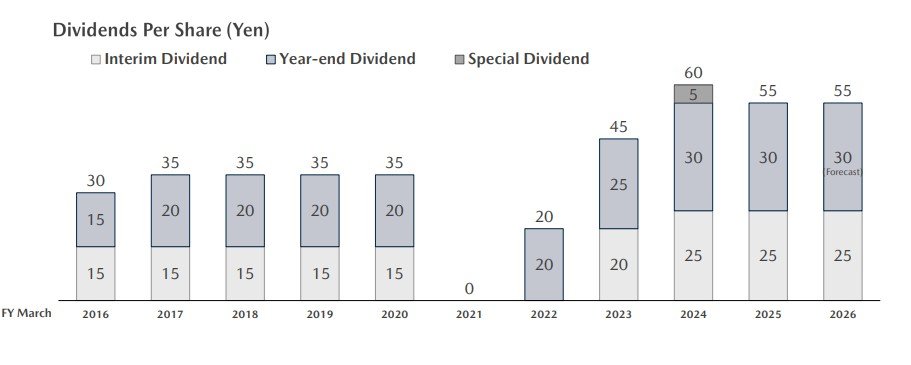
The dividend per share (DPS) progression from FY March 2016 to FY March 2026 shows two distinct patterns of stability and disruption, which reveal fundamental aspects of capital return practices and financial management standards.
Between FY2016 and FY2020, Mazda paid out annual dividends that stayed within the range of ¥30 to ¥35 per share through an interim dividend of ¥15 and a year-end dividend that varied between ¥15 and ¥20.
- Dividend investors find this consistency valuable because it establishes stable income streams, which the company uses to generate predictable returns.
- FY2021 marked a sharp inflexion point, with dividends dropping to ¥0, reflecting the severe impact of global disruptions, including supply chain constraints and pandemic-driven demand shocks.
- The company’s filing documents show that Mazda uses a defensive approach to manage its liquidity resources during times of crisis.
- The recovery phase began in FY2022, with DPS rebounding to ¥20, followed by a strong acceleration to ¥45 in FY2023 and peaking at ¥60 in FY2024, including a ¥5 special dividend.
- The introduction of a special dividend demonstrates that the company will use its surplus cash to distribute extra profits to shareholders based on its rising profitability performance metrics, which will increase investor confidence.
- The dividend growth rate from FY2022 to FY2024 shows more than 200% growth, which serves as a strong signal that the company has achieved earnings recovery.
- Mazda projects an annual dividend payout of ¥55 for both FY2025 and FY2026, which will consist of a ¥25 interim payment and a ¥30 year-end payment.
- The company provides guidance that shows it will adopt sustainable payout ratios while its earnings will become more predictable instead of pursuing aggressive dividend growth.
- Mazda’s dividend profile demonstrates a transition from stability to shock, and then strong recovery, aligning with its broader financial performance turnaround.
Mazda Motor Corporation North America The “Large Architecture” Revenue Driver (CX-70 and CX-90)
- Mazda’s 2026 profitability model in North America establishes a fundamental change from volume-based expansion toward premium market growth, which the company supports through its Large Architecture framework.
- Mazda establishes a new pricing standard through its decision to market costlier Mazda CX-90 and Mazda CX-70 vehicles, which drive changes in its average transaction price, total revenue, and profit margins.
- The numbers clearly validate this pivot. Mazda’s U.S. ATP has risen from approximately USD 32,000 to ~USD 38,500, which represents a USD 6,500 per unit increase that results in higher profit per vehicle while maintaining existing sales levels (Kelley Blue Book, TrueCar).
- The CX-90 plays a central role because its pricing ranges from USD 40,330 to USD 58,900, yet actual sales prices mostly fall between USD 43,000 and USD 51,000, which shows that customers highly prefer premium product versions (Car and Driver, KBB). TrueCar data shows that average transaction prices reach approximately USD 39,000, which demonstrates that retailers maintain high pricing standards while offering discounts at low levels.
- The CX-70 model becomes part of this plan because it starts at USD 42,250 while competing against premium brands like BMW X3 and Mercedes-Benz GLC, which shows that Mazda has shifted its brand strategy to near-luxury status (Mazda Press Release).
- The premium SUV business model continues to benefit from its ability to produce a higher blended average transaction price (ATP) because actual volume performance has decreased.
- The shared Large Platform system functions as an essential element that helps organizations reduce their operational expenses.
- The two SUVs use a 3.3L turbocharged inline-six engine with rear-biased all-wheel drive and shared electronic systems, which allow Mazda to distribute its research and development expenditures across its entire product range.
- The platform leverage function serves as vital support for mid-sized original equipment manufacturers who need to compete in the market against major companies such as Toyota and Volkswagen.
- The U.S. market saw Mazda complete 410346 vehicle sales during 2025, which represented a 3.3% decrease when compared to the previous year.
- The company experienced improved profitability because of its product mix and increased average transaction prices, according to its official statement.
- The monthly sales data confirms the existing pattern because CX-90 vehicles sold 5345 units during January 2025, which showed strong demand protection for premium SUV vehicles.
- The residual value of used CX-90 models, which ranges from approximately USD 38500 to USD 39600, directly increases lease profitability while decreasing the need for sales incentives, which helps maintain higher profit margins according to CarGurus.
- The Mazda CX-50 Hybrid model, which has a price range of USD 39000 to USD 41000, sold 10415 units during January 2026, which demonstrates a pattern of increasing pricing strength.
U.S. Manufacturing Synergy – Mazda Toyota Manufacturing (MTM)
- The Mazda Toyota Manufacturing (MTM) facility, which operates in Huntsville, Alabama, has developed into Mazda’s most important business asset for North America.
- The MTM facility operates as the only assembly plant in the United States that produces Mazda vehicles, while it serves as the main manufacturing site for the Mazda CX-50 model.
- The plant can produce 300000 units annually, which Mazda and Toyota share equally between their operations according to their production system (Toyota Pressroom Alabama News Center).
- The indicators that became available by Q1 2026 show that Mazda’s production system operates near full capacity because CX-50 sales reached 10415 units during January 2026, which marked an all-time peak according to Mazda Reports.
- The quarterly production of 37500 units generates revenue between USD 1.3 billion and USD 1.4 billion, which establishes MTM as one of Mazda’s top revenue-producing assets in its worldwide operations.
- The USD 2.3 billion total investment in the facility underscores its importance in delivering cost-efficient, high-volume output.
- Vehicles produced at MTM qualify under USMCA, which enables them to avoid 25% import tariffs that apply to Japan-built vehicles, resulting in better pricing power and margin stability for the U.S. market, according to Mazda Statements. This positions the CX-50 as both a volume driver and a profitability anchor.
- The operational processes of MTM demonstrate manufacturing flexibility together with platform efficiency. The facility manufactures standard vehicles and hybrid vehicles, which include Toyota-derived hybrid systems, using a single production line that simplifies operations while allowing multiple powertrain systems to be produced.
- The location of the facility near Toyota’s Alabama engine plant enables efficient just-in-time logistics, which results in decreased supply chain expenses.
Conclusion
Mazda will operate in 2025 and 2026 because the company needs to establish its new business model, which will generate consistent revenue streams but face major profit challenges from its electric vehicle development expenses, increased operational costs, and unpredictable customer demand. The company achieved export growth while maintaining pricing power in North America, which shows that its premium SUV business approach has succeeded despite experiencing weaknesses in domestic sales and international market performance.
The financial situation shows short-term difficulty through negative cash flow and decreasing earnings, but Mazda will recover in the future because of its hybrid and electric vehicle and platform development investments. Mazda implements a business transformation from volume-based expansion to sustainable profitability development in order to enhance its competitive position within the changing global automotive market.
FAQ
Mazda expects net sales of ¥4.82 trillion, a 4.0% YoY decline.
High electrification costs, increasing input expenses, and research and development expenditures cause profit declines for the company.
The company experienced a 6.7% production increase in February 2026 compared to the previous year, but total production from January to February decreased by 2.9%.
North America leads with a 34.0% increase in exports.
Mazda will increase its long-term profit margins through its premium SUV business strategy, its ability to charge higher prices, and its commitment to electric vehicle development.