


Northeast Indiana Bancorp reported Q1 2026 net income of $1.60 million and diluted EPS of $0.68, up from $0.44 a year ago, with stronger net interest income and lower credit loss provisions supporting profitability; after‑hours movement is not disclosed, so investor reaction will hinge on credit quality trends and asset growth.
About Northeast Indiana Bancorp, Inc.
Northeast Indiana Bancorp, Inc. (OTCQB: NIDB) is the holding company for First Federal Savings Bank, a community banking institution headquartered in Huntington, Indiana. The company was formed as a unitary savings and loan holding company in 1995 through a mutual to stock conversion and later converted to a bank holding company in 2012.
From its headquarters at 648 North Jefferson Street in Huntington, NIDB operates nine full‑service offices across Huntington, Warsaw, Fort Wayne, and Roanoke, Indiana, offering retail and commercial banking plus financial brokerage services. NIDB’s shares trade on the OTCQB platform under the ticker “NIDB”, with 2,366,342 common shares outstanding as of March 31, 2026 and a book value of $23.63 per share.
While the exact current market cap and P/E ratio are not disclosed in the release, the book value and share count imply a modest community bank valuation profile typical of OTC‑traded institutions. The company reported an annualized return on average assets of 1.14% and return on average equity of 11.51% for Q1 2026, metrics that indicate solid profitability for a regional community bank.
Top Financial Highlights
- Net income for Q1 2026 increased to $1,599,000 compared with $1,059,000 in Q1 2025, reflecting stronger core earnings and lower credit loss provisions.
- Diluted earnings per share rose to $0.68 from $0.44 a year earlier, highlighting meaningful EPS growth for shareholders.
- Annualized return on average assets reached 1.14% in Q1 2026 versus 0.80% in Q1 2025, showing improved asset‑level profitability.
- Annualized return on average equity improved to 11.51% from 8.71% in the prior‑year quarter, indicating better equity utilization.
- Net interest income was $4,752,133 in Q1 2026, up from $4,137,519 in Q1 2025, an increase of $615,000 supported by higher net interest margin.
- Net interest margin expanded to 3.51% in Q1 2026 from 3.23% in Q1 2025, despite a higher‑rate environment and funding cost pressures.
- Provision for credit loss expense was $180,000 in Q1 2026, down sharply from $620,017 in Q1 2025, providing a tailwind to net income.
- Total non‑interest income was $663,538 in Q1 2026 compared to $711,553 in Q1 2025, reflecting slightly lower fee and gain‑on‑sale revenues.
- Total non‑interest expense rose to $3,314,013 from $3,045,398 a year earlier, driven by higher salaries and employee benefits, data processing, and professional fees.
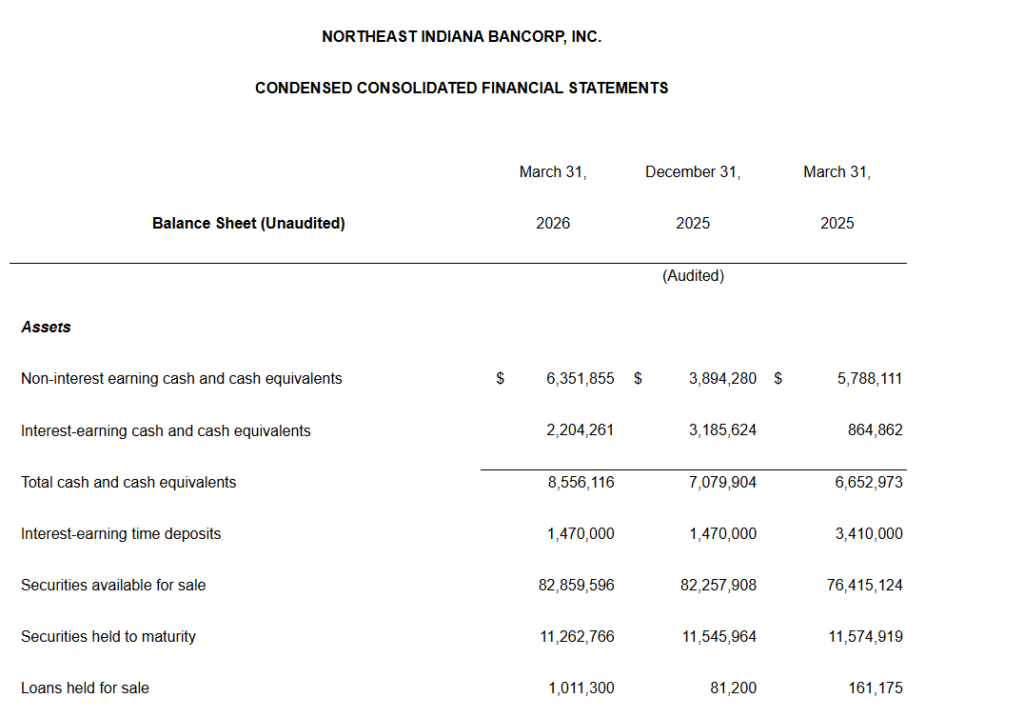
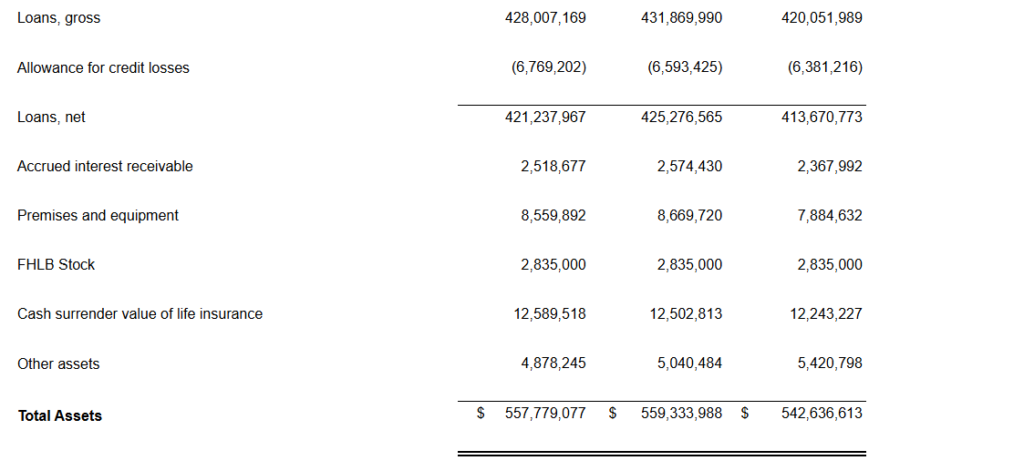
- Total assets were $557.8 million at March 31, 2026, down $1.6 million or ‑1.1% on an annualized basis from $559.3 million at December 31, 2025.
- Total net loans declined to $421.2 million at March 31, 2026 from $425.3 million at December 31, 2025, an annualized decrease of ‑3.8% as lending balances softened.
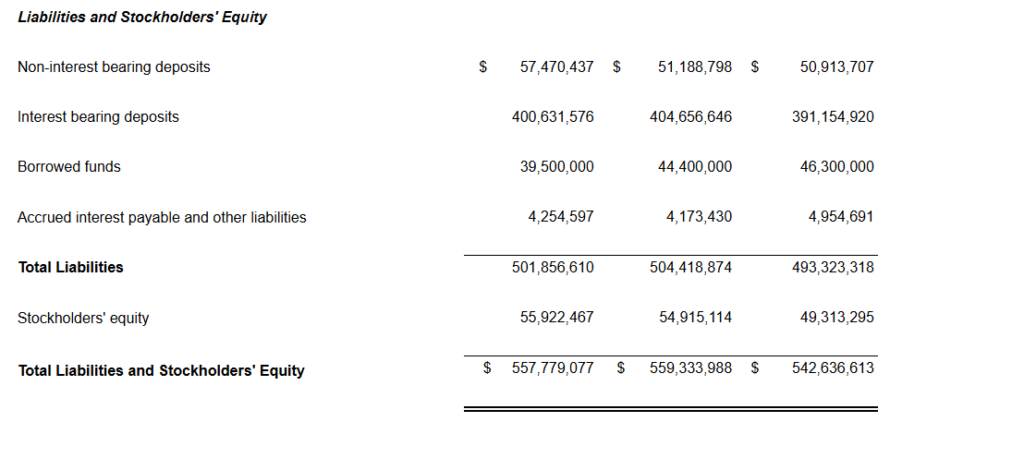
- Total deposits increased to $458.1 million at March 31, 2026 from $455.8 million at December 31, 2025, an annualized growth rate of approximately 2%.
- Shareholders’ equity rose to $55.9 million from $54.9 million at year‑end 2025, with book value per share up $0.44 to $23.63.
- The allowance for credit losses ended the quarter at $6,769,202, representing 1.58% of gross loans and 63.13% coverage of non‑performing loans.
- Non‑performing assets increased to $10,722,587, equal to 1.92% of total assets, compared with 0.96% of total assets a year earlier, signaling higher credit stress in specific credits.
Beat or Miss?
Public analyst estimates or consensus expectations for this thinly covered OTCQB community bank are not provided in the release or readily referenced, so a traditional beat‑versus‑miss framing cannot be quantified. The table below therefore contrasts reported metrics with “N/A” for estimates and includes brief context.
| Metric | Reported Q1 2026 | Difference / Analysis |
| Net income | $1,599,000 | Up from $1,059,000 in Q1 2025; strong YoY growth driven by higher net interest income and lower provisions. |
| Diluted EPS | $0.68 | Up from $0.44 in Q1 2025; no published consensus estimates, so beat/miss status is N/A. |
| Net interest margin | 3.51% | Improved from 3.23% a year ago; reflects better asset yields relative to funding costs. |
| Provision for credit losses | $180,000 | Down sharply versus $620,017 in Q1 2025; supports earnings but coincides with higher non‑performing assets. |
| Non‑interest income | $663,538 | Slightly lower than $711,553 a year ago; fee income and gains on loan sales remain stable overall. |
| Non‑interest expense | $3,314,013 | Up from $3,045,398, reflecting higher personnel and operating costs in a growth environment. |
What Leadership Is Saying?
Michael S. Zahn, President and Chief Executive Officer, emphasized that management’s current expectations are shaped by economic, legislative, and regulatory trends, noting that forward‑looking results remain sensitive to interest rates, loan demand, and competitive dynamics.
Travis A. Penrod, Senior Vice President and Chief Financial Officer, highlighted that factors such as general economic conditions, changes in interest rates, and credit quality could cause actual financial results and margins to differ materially from current projections.
Historical Performance
YoY Comparison for Northeast Indiana Bancorp, Inc.
| Category | Q1 2026 (Current) | Q1 2025 (Previous Year) | Change (%) |
| Net income | $1,598,541 | $1,058,961 | ≈ +51% increase in earnings. |
| Diluted EPS | $0.68 | $0.44 | ≈ +55% EPS growth. |
| Net interest income | $4,752,133 | $4,137,519 | ≈ +15% growth in net interest income. |
| Non‑interest income | $663,538 | $711,553 | ≈ ‑7% decline in non‑interest income. |
| Non‑interest expense | $3,314,013 | $3,045,398 | ≈ +9% increase in operating costs. |
| ROA (annualized) | 1.14% | 0.80% | Improvement of ~0.34 percentage points. |
| ROE (annualized) | 11.51% | 8.71% | Improvement of ~2.8 percentage points. |
Operating expenses are proxied here using total non‑interest expense, which captures personnel and overhead costs. Although revenue is not explicitly labeled, net interest income plus non‑interest income together indicate that core banking revenue expanded faster than expenses, supporting margin and profitability improvement.
Historical Performance of Selected Peers (YoY snapshot)
Public community bank peers can provide context for NIDB’s performance trajectory, though their scale and markets differ. Below is an illustrative YoY snapshot for two regional peers based on their Q1 2026 disclosures.
| Category | Q1 2026 – NB Bancorp, Inc. | Q1 2025 – NB Bancorp, Inc. | Change (%) |
| Net income | $15.0 million | $7.7 million | ≈ +95% YoY, aided by M&A effects and scaling. |
| Diluted EPS | $0.36 | $0.19 | ≈ +89% YoY EPS growth. |
| Operating net income* | $15.8 million | $21.2 million | ≈ ‑25% YoY on an operating basis vs prior quarter; YoY Q1 detail not fully disclosed. |
| Category | Q1 2026 – First BanCorp | Q1 2025 – First BanCorp | Change (%) |
| Net income | $46.7 million | $36.4 million | ≈ +28% YoY. |
| Diluted EPS | $1.13 | Noted at lower prior level | Double‑digit EPS growth; exact % implied by earnings surprise. |
These peers show that many regional and community banks are reporting solid YoY earnings growth in Q1 2026, often driven by higher net interest margins and specific strategic actions such as acquisitions, which broadly aligns with NIDB’s positive earnings trajectory despite its smaller scale.
How the Market Reacted?
The Q1 2026 earnings release for Northeast Indiana Bancorp does not include any discussion of share price movement or immediate market reaction, which is common for OTC‑traded community banks with limited analyst coverage. In the absence of disclosed trading data, sentiment appears fundamentally constructive given the strong YoY growth in net income, EPS, ROA, and ROE, offset by a notable increase in non‑performing assets.
Investors are likely to view the quarter as modestly bullish, balancing improved profitability and capital with rising credit risk indicators and modest loan contraction. Future quarters will likely be assessed through the lens of credit quality stabilization, deposit growth, and the sustainability of the current net interest margin.
