


Levi Strauss (NYSE: LEVI) delivered a double beat for Q4 FY2025, posting adjusted EPS of $0.41 (vs. $0.39 expected) and revenue of $1.77B (vs. $1.71B estimated). Despite surpassing consensus on both metrics, shares fell ~3.7% in after-hours trading as below-consensus FY2026 EPS guidance and tariff headwinds dampened investor sentiment.
About Levi Strauss & Co.
Levi Strauss & Co. (NYSE: LEVI) is one of the world’s largest brand-name apparel companies and a global leader in jeanswear, founded in 1853 and headquartered in San Francisco, California. The company designs and markets jeans, casual wear, and related accessories under the Levi’s®, Levi Strauss Signature™, and Beyond Yoga® brands, with products sold in approximately 120 countries through a network of roughly 3,300 retail stores and shop-in-shops, in addition to major wholesale and e-commerce channels.
As of early April 2026, LEVI carries a market capitalization of approximately $7.3-$7.4 billion and trades at a P/E ratio of ~17x. The stock pays a dividend yield of approximately 2.9%, reflecting an annual dividend of $0.54 per share as of FY2025, up 7% year-over-year.
LEVI employs tens of thousands globally and reported full-year net revenues of $6.3 billion in FY2025, up 4% reported and 7% on an organic basis. The company’s transformation toward a direct-to-consumer (DTC)-first model with DTC comprising 49% of Q4 revenues and its expansion into a “head-to-toe denim lifestyle” brand are the key strategic pillars shaping its near-term growth.
Top Financial Highlights
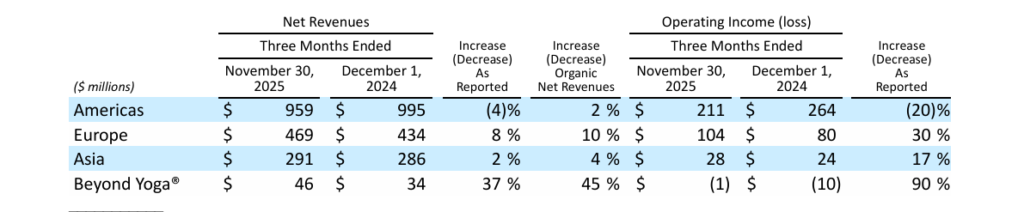
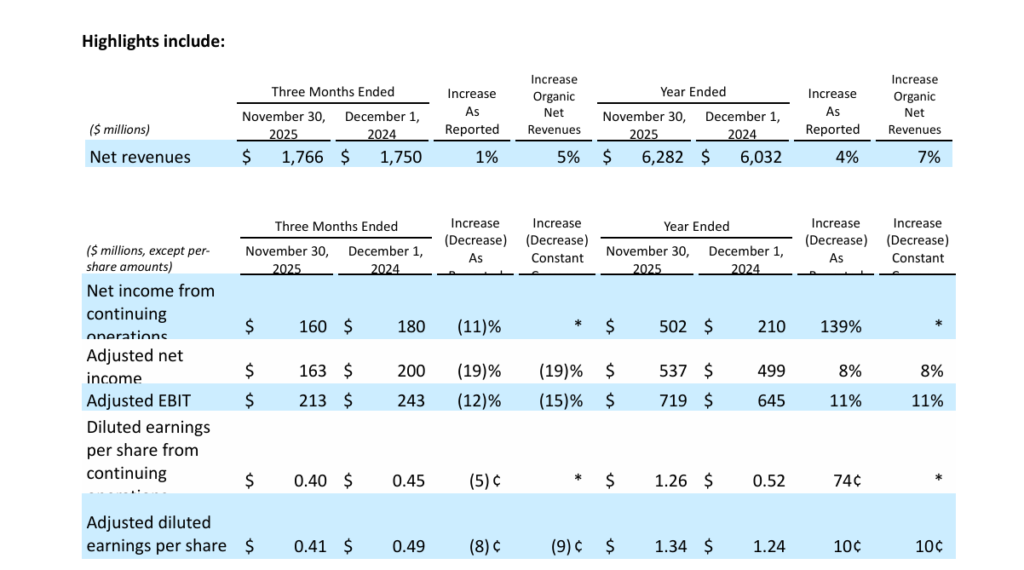
- Q4 2025 total revenue reached $1.766 billion, increasing 1% on a reported basis and 5% organically compared to Q4 2024.
- Adjusted EPS was $0.41, exceeding analyst expectations of $0.39 by approximately 4.6% to 5.1%.
- GAAP diluted EPS from continuing operations stood at $0.40, down from $0.45 in Q4 2024.
- Net income from continuing operations was $160 million, compared to $180 million in the prior year period.
- Gross margin was 60.8%, declining by 100 basis points due to tariff-related pressures.
- Adjusted EBIT margin was 12.1%, down from 13.9% in Q4 2024, impacted by the absence of a prior-year benefit.
- Adjusted EBITDA reached $268.2 million, with a 15.2% margin, broadly in line with expectations.
- Direct-to-consumer revenue grew 8% reported and 10% organically, marking the 15th consecutive quarter of positive comparable growth.
- E-commerce revenue increased 19% reported and 22% organically, reflecting strong digital demand.
- Beyond Yoga recorded growth of 37% reported and 45% organically, indicating strong brand momentum.
- Full year 2025 revenue reached $6.282 billion, increasing 4% reported and 7% organically compared to FY2024.
- Gross margin improved to 61.7%, up 110 basis points, representing the highest level recorded by the company.
- Operating margin rose to 10.8% from 4.4% in FY2024, reflecting improved operational efficiency.
- Adjusted EBIT margin increased to 11.4%, compared to 10.7% in the previous year.
- Net income from continuing operations reached $502 million, growing 139% from $210 million in FY2024.
- Adjusted net income was $537 million, up 8% from $499 million.
- Adjusted diluted EPS increased to $1.34, compared to $1.24 in FY2024.
- Operating cash flow totaled $530 million, while adjusted free cash flow reached $308 million.
- Cash and cash equivalents stood at $757.9 million, with total liquidity of approximately $1.7 billion.
- Shareholder returns reached $363 million, up 26%, including $213 million in dividends and $150 million in share buybacks, alongside a new $200 million accelerated share repurchase program.
- FY2026 guidance indicates reported revenue growth of 5% to 6% and organic growth of 4% to 5%.
- Gross margin is expected to remain broadly stable compared to the prior year.
- Adjusted EBIT margin is projected in the range of 11.8% to 12.0%, indicating expansion.
- Adjusted diluted EPS is expected between $1.40 and $1.46, with a midpoint of $1.43, approximately 3.4% below analyst consensus.
- The effective tax rate is projected at around 23%, including an estimated $0.04 EPS headwind.
- Guidance assumptions include 30% tariffs on imports from China and 20% tariffs on imports from the rest of the world.
Beat or Miss?
| Metric | Reported | Analyst Estimate | Difference / Analysis |
| Q4 Revenue | $1.766B | $1.71B | +3.4% beat; flat YoY (prior year had 53rd-week benefit worth ~$78M) |
| Q4 Adjusted EPS | $0.41 | $0.39 | +5.1% beat; 5th consecutive quarter of beats |
| Q4 Adjusted EBITDA | $268.2M | $268.3M | In line (15.2% margin) |
| Q4 Operating Margin | 11.90% | ~11.9% | In line with same quarter last year |
| FY2025 Revenue | $6.282B | ~$6.03B prior year base | Up 4% reported, 7% organic – exceeded internal targets |
| FY2026 EPS Guidance | $1.40–$1.46 midpoint $1.43 | $1.48 | -3.4% miss on forward guidance – key reason for stock decline |
| FY2026 Gross Margin | Flat guidance | Expected expansion | Headwind from ongoing tariff pressure |
What Leadership Is Saying
CEO Michelle Gass – On Strategy & Vision:
“Over the past few years, we’ve taken bold steps toward becoming a DTC-first, head-to-toe denim lifestyle brand. We have narrowed our focus, improved operational execution and built greater agility across the organization. As a result, we’ve elevated the Levi’s® brand and delivered faster growth and higher profitability, as reflected by our Q4 and full year 2025 results. While we still have important work ahead, the company is at an inflection point – emerging as a stronger, more resilient global business ready to define the next chapter of LS&Co.”
CFO Harmit Singh – On Financials & Margins:
“We are sustaining our momentum, delivering 5% organic growth in the fourth quarter on top of an 8% increase in the prior year. Our success in denim lifestyle has enabled us to expand our addressable market, positioning us for mid-single digit growth in 2026 and beyond. Our disciplined approach to converting growth into profitability has improved adjusted EBIT margin in 2025 for the third year in a row, and we are on track to expand margins further as we strive toward 15%. Our confidence in this trajectory is reflected in a new $200 million ASR program.”
Historical Performance
Levi Strauss YoY Comparison
| Category | Q4 FY2025 (Nov 30, 2025) | Q4 FY2024 (Dec 1, 2024) | Change (%) |
| Net Revenue | $1,765.8M | $1,749.9M | +0.9% (+5% organic) |
| Net Income (Cont. Ops) | $160.2M | $180.3M | -11.10% |
| Adjusted Net Income | $163M | $200M | -18.50% |
| Gross Profit | $1,072.8M | $1,081.0M | -0.80% |
| SG&A Expenses | $859.8M | $858.5M | 0.20% |
| Gross Margin | 60.80% | 61.80% | -100 bps |
| Adjusted EBIT Margin | 12.10% | 13.90% | -180 bps |
| Diluted EPS (Cont. Ops) | $0.40 | $0.45 | -$0.05 (-11%) |
| Adjusted Diluted EPS | $0.41 | $0.49 | -$0.08 (-16%) |
Full-Year Comparison (FY2025 vs. FY2024)
| Category | FY2025 | FY2024 | Change (%) |
| Net Revenue | $6,282M | $6,032M | +4.1% (+7% organic) |
| Net Income (Cont. Ops) | $502M | $210M | 138.90% |
| Gross Margin | 61.70% | 60.60% | +110 bps (record high) |
| Adjusted EBIT Margin | 11.40% | 10.70% | +70 bps |
| Operating Cash Flow | $530M | $898M | -41% (prior year was elevated) |
| Adjusted Diluted EPS | $1.34 | $1.24 | 8.10% |
Competitor Benchmarking
Q4 / FY2025 Peer Comparison
The following table benchmarks Levi Strauss against key apparel peers for their most recently reported equivalent periods.
| Company | Q4 Revenue | Q4 YoY Revenue Change | Q4 Net Income / EPS | Key Takeaway |
| Levi Strauss (LEVI) | $1.77B | +1% reported / +5% organic | $160M / $0.40 diluted EPS | Beat estimates; tariffs compressed Q4 margins |
| VF Corp (VFC) | $2.83B | +4.9% YoY | N/A adj. loss improved / $0.61 adj. EPS | Revenue beat by 3.1%; full-year revenue down 4% to $9.5B; net debt cut 26% |
| PVH Corp (PVH) | $2.505B | +5.6–6% YoY | Net loss of -$158M / -$3.46 diluted; adj. EPS $3.82 (+17%) | Beat guidance; Calvin Klein & Tommy Hilfiger drove growth; tariffs -170 bps impact |
YoY Competitor Revenue Trajectory
| Company | FY2025 Full-Year Revenue | FY2024 Full-Year Revenue | YoY Change |
| Levi Strauss (LEVI) | $6.28B | $6.03B | +4.1% (+7% organic) |
| VF Corp (VFC) | $9.5B | ~$9.9B (est.) | -4% |
| PVH Corp (PVH) | ~$9.1B | ~$8.8B | +3% reported |
Levi Strauss outperformed VF Corp meaningfully in FY2025, as VF Corp’s transformation efforts weighed on top-line performance across its Vans and Dickies brands. PVH delivered comparable reported revenue growth but faced steeper margin pressure from tariffs on its Calvin Klein and Tommy Hilfiger merchandise portfolios.
How the Market Reacted?
Despite a clean double-beat on both revenue and earnings per share, Levi Strauss’s stock declined approximately 3.3-3.7% in after-hours trading on January 28, 2026, falling from a pre-earnings price of $21.25 to close at around $20.54. Investor sentiment turned cautious primarily because the company’s FY2026 adjusted EPS guidance of $1.40-$1.46 came in at the midpoint of $1.43 – approximately 3.4% below the analyst consensus of $1.48, signaling that tariff-driven margin pressure will persist through the year ahead.
The market’s negative reaction was further amplified by three structural concerns: (1) gross margin compressing 100 bps to 60.8% in Q4 due to tariff costs, despite partial offsets from initial price increases; (2) adjusted EPS of $0.41 being down 16% from Q4 2024’s $0.49 despite the consensus beat; and (3) FY2026 gross margin guidance of “flat to prior year,” indicating tariffs will remain a sustained drag. By early April 2026, the stock had drifted further to approximately $18.87–$19.13, giving the company a market capitalization of roughly $7.3–$7.4 billion.