


RideNow Group, Inc. (NASDAQ: RDNW) posted Q1 2026 total revenue of $260.4 million, narrowly beating the analyst consensus of $258.8 million, with EPS of -$0.11, better than the estimated -$0.14. Net loss improved 55.7% year over year to $4.3 million. The stock traded at approximately $7.74 to $7.95 with muted after-hours movement following the after-market close release.
About RideNow Group, Inc.
RideNow Group, Inc. (NASDAQ: RDNW) is the largest powersports retail group in the United States, headquartered in Chandler, Arizona. The company was formerly known as RumbleOn, Inc., and operates a broad network of powersports dealerships selling new and pre-owned motorcycles, all-terrain vehicles (ATVs), utility terrain vehicles (UTVs), personal watercraft, snowmobiles, and related accessories.
RideNow also offers parts, apparel, finance and insurance products, and aftermarket services, and operates a proprietary RideNow Cash Offer tool to acquire vehicles directly from consumers, making it one of the largest buyers of pre-owned powersports vehicles nationwide.
As of May 2026, the company’s market cap is approximately $305.7 to $308.4 million, with roughly 38.7 million common shares outstanding. The trailing P/E ratio is -5.71, reflecting the company’s ongoing net loss position as it scales operations. No dividend is paid, and the company’s year-to-date stock return stands at +43.66% through May 14, 2026.
Top Financial Highlights
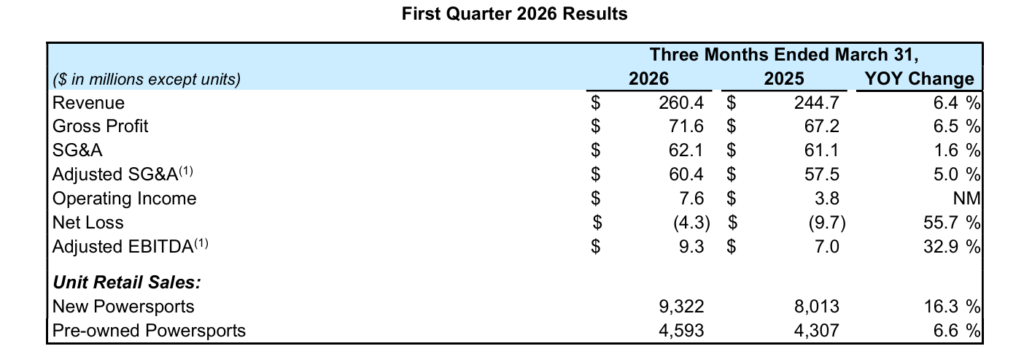
- Total revenue was $260.4 million in Q1 2026, up 6.4% from $244.7 million in Q1 2025, driven by strong new and pre-owned unit volume.
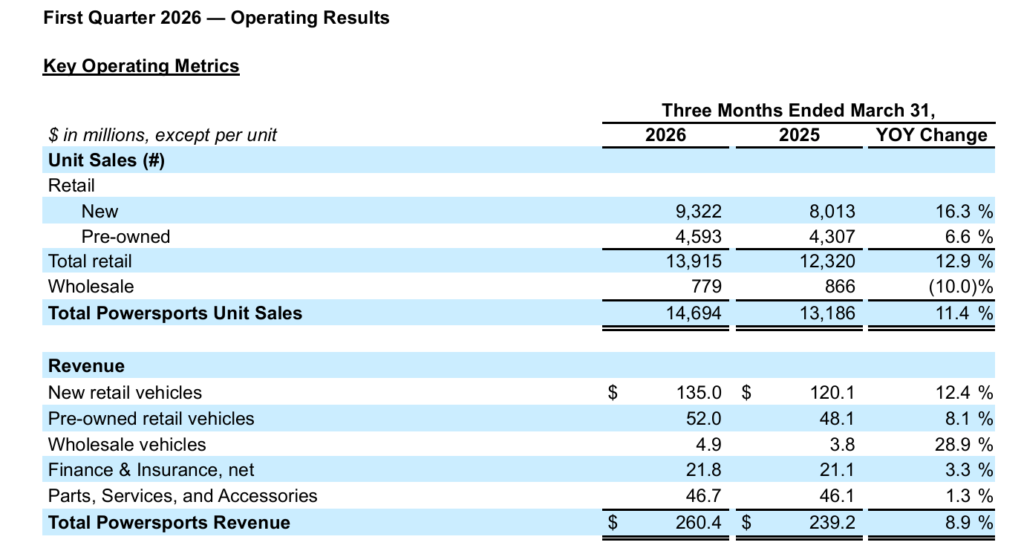
- On a same store basis, Powersports Revenue grew 13.1%, driven by a 16.3% increase in same store unit sales.
- Gross profit rose 6.5% to $71.6 million from $67.2 million in Q1 2025, with an overall gross margin of approximately 27.5%.
- Net loss improved 55.7% to -$4.3 million from a net loss of -$9.7 million in Q1 2025.
- Basic and diluted EPS was -$0.11, improving from -$0.26 in Q1 2025 on a weighted average share count of 38.4 million shares.
- Adjusted EBITDA increased 32.9% to $9.3 million from $7.0 million in the prior year period.
- SG&A expense was $62.1 million (86.7% of gross profit), improving from 90.9% of gross profit in Q1 2025; Adjusted SG&A fell to 84.3% of gross profit from 85.6%.
- Operating income reached $7.6 million, up from $3.8 million in Q1 2025, reflecting growing operating leverage.
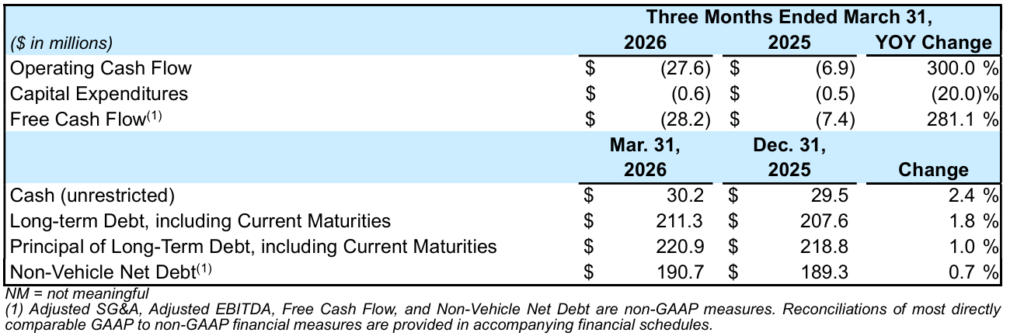
- Operating cash flow was negative at -$27.6 million versus -$6.9 million a year ago, largely driven by a $45.1 million inventory build as the company stocked for the spring selling season.
- Free Cash Flow was -$28.2 million, compared to -$7.4 million in Q1 2025, primarily reflecting the seasonal inventory investment.
- Unrestricted cash was $30.2 million at quarter end; total cash including restricted cash was $46.4 million; total available liquidity including floor plan availability was $145.7 million.
- Long-term debt including current maturities was $211.3 million; Non-Vehicle Net Debt was $190.7 million.
- Total new retail unit sales were 9,322, up 16.3% YoY; pre-owned retail units were 4,593, up 6.6% YoY.
- The company’s Term Loan leverage ratios remained well within covenant thresholds: Consolidated Total Net Leverage Ratio of 3.5x (maximum allowed 6.5x); Consolidated Senior Secured Net Leverage Ratio of 3.3x (maximum allowed 6.25x).
- No formal numerical guidance for Q2 2026 was provided; however, management commentary emphasized continued execution on near-term performance initiatives and structural changes to drive long-term shareholder value.
Beat or Miss?
| Metric | Reported | Estimated / Expected | Difference / Analysis |
| Total Revenue | $260.4M | $258.8M | Beat by $1.6M; modest but positive above-consensus delivery. |
| EPS (Basic & Diluted) | ($0.11) | ($0.14) | Beat by $0.03; net loss per share came in better than consensus. |
| Net Loss | -$4.3M | N/A | Net loss improved 55.7% YoY, well above the ~46% improvement analysts had modeled. |
| Adjusted EBITDA | $9.3M | N/A | Up 32.9% YoY; no published street estimate available for comparison. |
| Gross Profit | $71.6M | N/A | Grew 6.5% YoY; gross margin held at ~27.5%. |
| Operating Cash Flow | -$27.6M | N/A | Worse than Q1 2025’s -$6.9M; seasonal inventory investment of $45.1M is the primary driver. |
| Cash on Hand (unrestricted) | $30.2M | N/A | Up modestly from $29.5M at year-end 2025; total liquidity at $145.7M. |
What Leadership Is Saying?
“I am invigorated by our team’s unrelenting focus on execution, as evidenced by our first quarter results. Our tactical plan combines near-term initiatives to improve financial performance with structural changes to elevate the Company’s strategic direction. All of our effort is focused on driving long-term value creation for our shareholders, and our first quarter results are further evidence that we are on the right trajectory.”
— Michael Quartieri, Chairman, CEO and President, RideNow Group, Inc.
“The first quarter reflects meaningful financial progress across all key measures. We delivered gross profit of $71.6 million, up 6.5%, with Adjusted SG&A improving to 84.3% of gross profit compared to 85.6% in the prior year. Adjusted EBITDA grew 32.9% to $9.3 million as we continue to exercise cost discipline. Operating cash outflow of $27.6 million was driven by intentional inventory investment of $45.1 million in advance of the peak spring selling season, and our total available liquidity of $145.7 million positions us well for the quarters ahead. Both our Total Net Leverage Ratio of 3.5x and Senior Secured Net Leverage Ratio of 3.3x remain well within covenant limits.”
— RideNow Group CFO, on financials and margins
Historical Performance
| Category | Q1 2026 | Q1 2025 | Change (%) |
| Total Revenue | $260.4M | $244.7M | 6.40% |
| Net Loss | -$4.3M | -$9.7M | -55.7% (loss narrowed significantly) |
| Gross Profit | $71.6M | $67.2M | 6.50% |
| SG&A Expense | $62.1M | $61.1M | 1.60% |
| Adjusted EBITDA | $9.3M | $7.0M | 32.90% |
| EPS (Basic & Diluted) | ($0.11) | ($0.26) | +57.7% (loss per share improved) |
| Operating Cash Flow | -$27.6M | -$6.9M | -300% (higher seasonal inventory build) |
| New Retail Units | 9,322 | 8,013 | 16.30% |
| Pre-owned Retail Units | 4,593 | 4,307 | 6.60% |
| Total Retail Units | 13,915 | 12,320 | 12.90% |
| Unrestricted Cash | $30.2M | N/A | Up from $29.5M at Dec 31, 2025 |
| Non-Vehicle Net Debt | $190.7M | N/A | Up slightly from $189.3M at Dec 31, 2025 |
Competitor Performance Comparison
The table below compares Q1 2026 versus Q1 2025 for RideNow Group and its closest publicly listed comparable, Camping World Holdings (NYSE: CWH), which operates in the broader recreational vehicle and outdoor retail space.
| Category | RideNow (RDNW) Q1 2026 | RideNow Q1 2025 | Change (%) | Camping World (CWH) Q1 2026 | Camping World Q1 2025 | Change (%) |
| Total Revenue | $260.4M | $244.7M | 6.40% | $1,354.6M | $1,413.5M | -4.20% |
| Net Income / Loss | -$4.3M | -$9.7M | -55.7% (improved) | -$16.4M | -$12.3M | +33% (worsened) |
| EPS (Diluted) | ($0.11) | ($0.26) | +57.7% (improved) | ($0.26) | ($0.21) | -23.8% (worsened) |
| Gross Profit / Operating Metric | $71.6M gross profit | $67.2M | 6.50% | Revenue missed estimates by 3.7% | N/A | Below expectations |
| Adjusted EBITDA | $9.3M | $7.0M | 32.90% | N/A | N/A | Not directly comparable |
RideNow materially outperformed its nearest public comp in Q1 2026: it grew revenue 6.4% while Camping World’s revenue fell 4.2%, and RideNow’s net loss shrank sharply while Camping World’s net loss widened. This contrast highlights the powersports segment’s relative resilience versus the broader RV market, which faces more acute pressure from interest rates and consumer spending shifts.
How the Market Reacted?
RideNow Group (RDNW) shares traded in a range of $7.60 to $8.08 on May 13, 2026, the day before the results were released, and held at approximately $7.74 to $7.95 through May 14, 2026, a day-over-day change of roughly -0.38%. Despite the Q1 2026 EPS beat of -$0.11 versus the -$0.14 estimate and a 55.7% improvement in net loss, the muted price reaction suggests the market had already partially priced in a better quarter given the stock’s +43.66% year-to-date gain heading into earnings.
The overall tone of the report is bullish, with same store revenue up 13.1%, unit volumes growing double digits, and Adjusted EBITDA improving 32.9%, but elevated operating cash outflow of -$27.6 million driven by a $45.1 million inventory build warrants continued monitoring for the remainder of the year.