


Webull posted Q1 2026 adjusted EPS of $0.03, in line with consensus estimates, while GAAP net loss per share came in at $0.04. Total revenue reached $159.9 million, beating some analyst forecasts but missing others depending on the estimate source, up 36% year-over-year. The stock closed down 5.44% on May 21 following the results, trading at $6.61, though it recovered partially in after-hours trading.
About Webull Corporation
Webull Corporation (NASDAQ: BULL) is a digital investment platform headquartered in St. Petersburg, Florida, founded in 2017 under Fumi Technology. The company owns and operates Webull, a next-generation global brokerage infrastructure offering trading in stocks, ETFs, options, futures, fractional shares, and digital assets. The platform serves more than 27.6 million registered users across 15 markets spanning North America, Asia Pacific, Europe, Africa, and Latin America, offering retail investors 24/7 access to global financial markets.
As of May 22, 2026, BULL trades at approximately $6.62 with a market capitalization of roughly $3.5 billion, placing it in the mid-cap category. The stock carries a TTM P/E ratio of approximately -5.38, reflecting its current GAAP net loss position. Webull completed its business combination with SK Growth Opportunities Corporation in April 2025, listing on the NASDAQ under the ticker BULL. With a 52-week range of $4.50 to $18.32, the stock has experienced significant volatility since its listing.
Top Financial Highlights
- Total revenues reached $159.9 million, up 36% year-over-year from $117.4 million in Q1 2025.
- Equity and option order flow rebates totaled $84.4 million, up from $64.1 million in Q1 2025.
- Interest-related income grew to $40.1 million, compared to $31.1 million a year earlier.
- Handling charge income increased to $26.4 million, up from $17.5 million in Q1 2025.
- GAAP net loss attributable to the Company was $21.7 million, versus net income of $13.1 million in Q1 2025.
- Adjusted net income (Non-GAAP) totaled $9.2 million, down from $21.3 million in Q1 2025.
- Adjusted operating profit (Non-GAAP) was $14.8 million, compared to $28.7 million in the year-ago quarter.
- Adjusted operating profit per share (basic and diluted) stood at $0.03.
- Total operating expenses rose 68% year-over-year to $162.3 million, driven by higher marketing, brokerage, and share-based compensation costs.
- Share-based compensation expense totaled $17.2 million for the quarter.
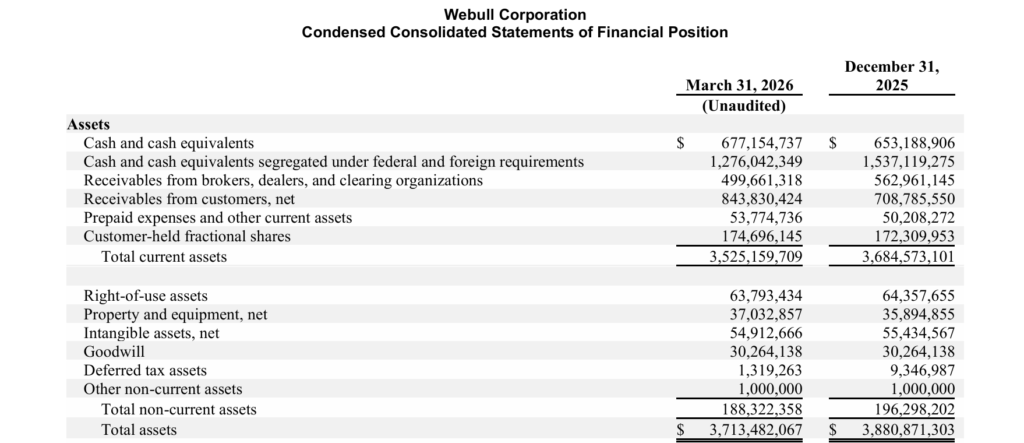
- Cash and cash equivalents stood at $677.2 million as of March 31, 2026.
- Customer assets reached $24 billion, a 90% year-over-year increase.
- Funded accounts grew 8% year-over-year to 5.1 million.
- Equity notional volume surged 104% year-over-year to $261 billion.
- DARTs (Daily Average Revenue Trades) increased 42% year-over-year to 1.3 million.
Beat or Miss?
Different data sources present varying consensus estimates, reflecting limited analyst coverage. The table below presents the most widely cited comparison.
| Metric | Reported | Consensus Estimate | Difference / Analysis |
| Total Revenue | $159.93M | $157.67M (Moomoo/S&P) / $166.21M (Businessquant) | Revenue beat by +1.43% vs S&P consensus; missed by -3.8% vs higher estimate |
| Adjusted EPS (Non-GAAP) | $0.03 | $0.03 (per Public.com) | In-line with consensus |
| GAAP Net Loss Per Share | -$0.04 | N/A | Consensus primarily tracked non-GAAP basis |
| Adjusted Net Income | $9.2M | N/A | Down 57% vs Q1 2025’s $21.3M |
| GAAP Net Income | -$21.7M | $9.06M (Moomoo) | Missed by -339.67% on GAAP basis |
| Revenue Growth YoY | +36% | Expected ~36-41% range | Growth met the trajectory but operating leverage compressed |
What Leadership Is Saying?
CEO Anthony Denier on Strategy and Vision
“I’m proud to report a strong start to our second year as a public company and meaningful progress in enhancing, expanding and extending our leading-platform for self-directed active traders. We continue to innovate in AI, including beta-testing for our Vega Analyst, which will bring comprehensive research reports to our users, as well as launching agentic trading solutions on Webull.
Our geographic expansion continues at a rapid pace, and we now have the license to operate across the European Economic Area, and we are deepening our presence in other markets across the globe. The demand from sophisticated, self-directed investors, including institutional and B2B clients, has never been greater and we are proud to be the platform of choice for our users and are committed to continuously improving the user experience while broadening our reach.”
CFO H.C. Wang on Financials and Capital Allocation
“Webull continued to deliver in the first quarter of 2026, recording strong revenue growth and our sixth consecutive quarter of profitability on an adjusted basis. We will continue to invest behind key growth drivers to further power our platform while prioritizing diligent execution and capital allocation priorities, including returning capital to shareholders through our previously announced share repurchase program.”
Historical Performance
| Category | Q1 2026 | Q1 2025 | Change (%) |
| Total Revenue | $159.9M | $117.4M | 36.30% |
| Equity and Option Order Flow Rebates | $84.4M | $64.1M | 31.70% |
| Interest-Related Income | $40.1M | $31.1M | 28.90% |
| Handling Charge Income | $26.4M | $17.5M | 50.50% |
| Other Revenues | $9.1M | $4.6M | 98.50% |
| Total Operating Expenses | $162.3M | $96.8M | 67.70% |
| Marketing and Branding | $49.4M | $23.0M | 114.90% |
| GAAP Net Income / (Loss) Attributable to Company | -$21.7M | +$13.1M | N/A (swing to loss) |
| Adjusted Operating Profit (Non-GAAP) | $14.8M | $28.7M | -48.40% |
| Adjusted Net Income (Non-GAAP) | $9.2M | $21.3M | -56.70% |
| Customer Assets | $24B | ~$12.6B (implied 90% YoY) | 90.00% |
| Registered Users | 27.6M | ~24.0M (implied 15% YoY) | 15.00% |
| DARTs | 1.3M | ~0.92M (implied 42% YoY) | 42.00% |
| Equity Notional Volume | $261B | ~$128B (implied 104% YoY) | 104.00% |
Competitor YoY Comparison
The table below compares Q1 2026 versus Q1 2025 performance across Webull and its key digital brokerage competitors: Robinhood Markets (HOOD) and Interactive Brokers Group (IBKR).
| Category | Webull Q1 2026 | Webull Q1 2025 | Change (%) | Robinhood Q1 2026 | Robinhood Q1 2025 | Change (%) | IBKR Q1 2026 | IBKR Q1 2025 | Change (%) |
| Total Revenue | $159.9M | $117.4M | 36.30% | $1.07B | $927M | 15.40% | $1.67B | ~$1.43B | 17.00% |
| Net Income / (Loss) | -$21.7M | +$13.1M | Swing | $346M | $336M | 3.00% | ~$1.28B (pretax) | N/A | N/A |
| Total Operating Expenses | $162.3M | $96.8M | 67.70% | $656M | ~$556M | 18.00% | $381M | ~$370M | 3.00% |
| Adjusted / Non-GAAP EPS | $0.03 | $0.06 (diluted) | -50.00% | $0.38 (diluted GAAP) | $0.37 | 2.70% | $0.60 (adjusted diluted) | $0.47 | 27.70% |
| Customer / Funded Accounts | 5.1M funded | ~4.7M (implied +8%) | 8.00% | 27.4M funded | ~25.8M | 6.20% | 4.75M accounts | 3.62M | 31.20% |
| Revenue YoY Growth | +36.3% | +32% (vs Q1 2024) | Accelerating | +15.4% | +45% (Q2 2025) | Decelerating | +17.0% | ~+14% | Stable |
How the Market Reacted?
Webull’s stock (NASDAQ: BULL) closed down 5.44% on May 21, 2026, the day of the earnings release, settling at $6.61 from a prior close of $6.99, with the session touching an intraday high of $7.21 and a low of $6.46. The market reaction reflected investor concern over the GAAP net loss of $21.7 million swinging from a prior-year profit, as well as a 68% surge in total operating expenses driven by aggressive marketing and share-based compensation.
However, the stock recovered partially in after-hours trading, rising approximately 1.5% to $6.71, as investors digested the strong 36% revenue growth and record operating metrics including a 104% jump in equity notional volume and 90% growth in customer assets. Analyst price targets for BULL average $11.67, with a high of $14.00 and a low of $9.00, suggesting significant potential upside from current levels if the company can demonstrate improved operating leverage in coming quarters.