


D2L Inc. delivered full-year fiscal 2026 EPS of $0.16 (basic and diluted) on total revenue of $217.5 million (+6% YoY), driven by a 10% surge in subscription revenue. Q4 revenue came in at $55.8 million, narrowly missing FactSet consensus of $56.6M. Shares fell 4.55% post-earnings to $8.58, then dropped a further 8.74% on April 2 to close at $7.83, reflecting investor caution around K-12 churn and margin pressure.
About D2L Inc.
D2L Inc. (TSX: DTOL), formerly known as Desire2Learn, is a global learning technology company headquartered in Kitchener, Ontario, Canada, founded in 1999 by John Baker. The company builds and operates Brightspace, a cloud-based learning management system (LMS) used across K-12, higher education, and corporate training markets. At fiscal year-end, D2L’s platform served more than 21 million users across 1,500+ customers in over 40 countries.
D2L trades on the Toronto Stock Exchange under the ticker DTOL, with a market capitalization of approximately $427 million CAD (based on ~54.5 million shares outstanding at the April 2026 share price of ~$7.83). The company carries no debt and ended fiscal 2026 with $119.2 million in cash. D2L does not pay a dividend. Its AI-powered product suite, including D2L Lumi and Creator+, reached an ARR milestone of $3.5 million in fiscal 2026 as adoption expands across the platform.
Top Financial Highlights
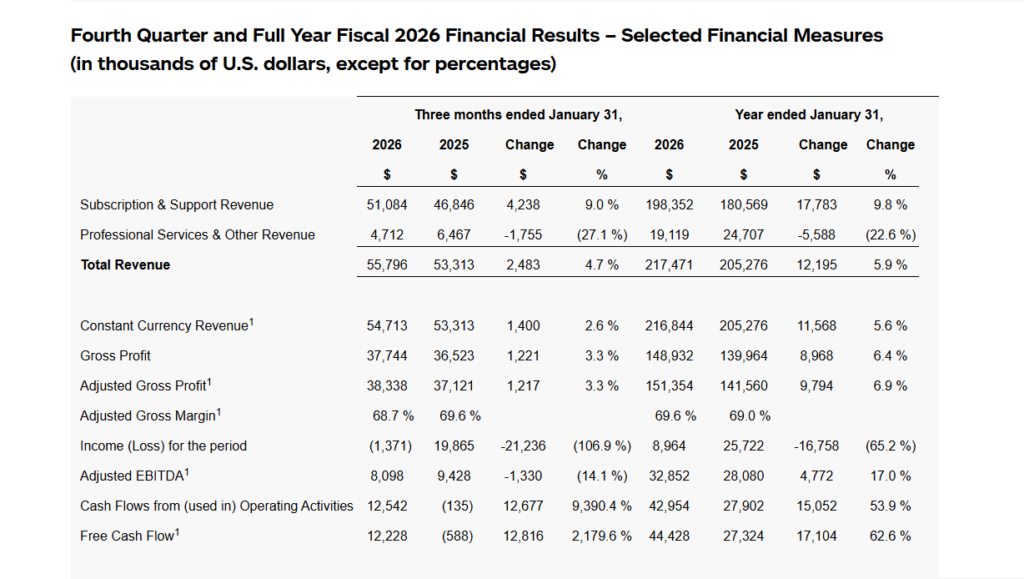
- Q4 total revenue reached $55.8 million, increasing 5% year over year.
- Full-year revenue totaled $217.5 million, reflecting a 6% increase compared to the prior year.
- Q4 subscription and support revenue was $51.1 million, up 9% year over year.
- Full-year subscription and support revenue reached $198.4 million, growing 10% year over year.
- Annual recurring revenue stood at $219.8 million, increasing 10%, with growth of approximately 14% excluding the K-12 segment.
- Full-year net income was $9.0 million, compared to $25.7 million in the prior year, which included a one-time tax benefit.
- Q4 reported a net loss of $1.4 million, compared to net income of $19.9 million in Q4 FY2025.
- Full-year EPS was $0.16 on both a basic and diluted basis.
- Adjusted EBITDA for Q4 was $8.1 million, representing a 14.5% margin, compared to $9.4 million and 17.7% margin in the prior year.
- Full-year adjusted EBITDA reached $32.9 million, increasing 17% year over year, with a 15.1% margin.
- Adjusted gross margin for Q4 was 68.7%, slightly lower than 69.6% in the previous year.
- Full-year free cash flow totaled $44.4 million, rising 63% year over year, with a 20.4% margin.
- Cash and cash equivalents stood at $119.2 million, with no outstanding debt.
- FY2027 revenue guidance is projected between $231 million and $234 million, indicating growth of 6% to 8%.
- FY2027 adjusted EBITDA is expected in the range of $33 million to $35 million, with an approximate 15% margin at the midpoint.
Beat or Miss?
| Metric | Reported | Consensus Estimate | Difference / Analysis |
| Q4 Total Revenue | $55.8M | $56.6M (FactSet) | Narrow miss of ~$0.8M (-1.4%) |
| Full-Year Total Revenue | $217.5M | N/A | +6% YoY growth |
| Full-Year EPS (Diluted) | $0.16 | N/A | Down from $0.46 prior year; driven by non-recurring FY2025 tax benefit |
| Q4 Adjusted EBITDA | $8.1M | N/A | Below prior year’s $9.4M; database migration costs cited |
| Full-Year Free Cash Flow | $44.4M | N/A | Beat own trajectory: +63% YoY, well above FY2025’s $27.3M |
| ARR | $219.8M | N/A | Beat internal expectation; subscription NRR at 100.9% (103.7% ex-K12) |
What Leadership Is Saying?
CEO – John Baker (Founder & CEO)
“The D2L team delivered strong execution in product innovation and new bookings in Fiscal 2026. We reported 10% subscription growth, increased ARR by 10% to nearly $220 million, increased free cash flow by 63%, and further strengthened our balance sheet. Our results reflect the competitive strength of D2L as we remain the fastest-growing learning platform in our main markets. While near-term reported revenue is impacted by the previously disclosed churn from U.S. K-12 clients, demand across our core growth markets – higher education, corporate and international – remains robust, and our pipeline entering the new fiscal year is healthy.”
“Over the past year, we meaningfully expanded AI capabilities across the D2L platform. Our AI-first approach is resonating with customers, driving revenue momentum for D2L Lumi and more broadly underpinning our continued success in winning and retaining customers across our core platform as we invest for long-term global growth.”
CFO – Josh Huff (CFO)
“Total revenue increased 5% in Q4 to $55.8 million and 6% for the full year to $217.5 million. Subscription and support revenue increased 9% in Q4 to $51.1 million, driven by new customer growth and expansion from existing customers, and was partially offset by U.S. K-12 churn. For the full year, subscription and support revenue increased 10% to $198.4 million. Annual recurring revenue grew by 10% to $219.8 million and 7% on a constant currency basis.”
“We are pleased with the progress in Q4, especially in Global Higher Ed and Corporate. We expect to continue operating in the low double-digit range for ARR growth in fiscal 2027, despite some offset from the U.S. K-12 market. The core growth rate, which represents 90% of our ARR, is expected to continue.”
Historical Performance (YoY Comparison)
| Category | Q4 FY2026 | Q4 FY2025 | Change (%) |
| Total Revenue | $55.8M | $53.3M | 4.70% |
| Subscription & Support Revenue | $51.1M | $46.8M | 9.00% |
| Professional Services Revenue | $4.7M | $6.5M | -27.10% |
| Adjusted Gross Profit | $38.3M | $37.1M | 3.30% |
| Adjusted Gross Margin | 68.70% | 69.60% | -90 bps |
| Adjusted EBITDA | $8.1M | $9.4M | -14.10% |
| Net Income (Loss) | ($1.4M) | $19.9M | N/M* |
| Free Cash Flow | $12.2M | ($0.6M) | Turnaround |
| Category | FY2026 | FY2025 | Change (%) |
| Total Revenue | $217.5M | $205.3M | 5.90% |
| Subscription & Support Revenue | $198.4M | $180.6M | 9.80% |
| Adjusted EBITDA | $32.9M | $28.1M | 17.00% |
| Net Income | $9.0M | $25.7M | -65.1%** |
| Free Cash Flow | $44.4M | $27.3M | 62.60% |
| Cash & Equivalents | $119.2M | $99.2M | 20.20% |
Competitor Performance (YoY Comparison)
D2L’s primary competitors in the Learning Management System (LMS) market are Instructure (Canvas), Anthology (Blackboard), and Moodle. Instructure operates as a private company after going private in 2021; Blackboard/Anthology and Moodle are also privately held, limiting direct public financial comparison.
| Company | Estimated Revenue (Recent) | Prior Year Revenue | YoY Change | Key Note |
| D2L (TSX: DTOL) | $217.5M (FY2026) | $205.3M (FY2025) | 6% | Public; 10% subscription growth; AI-first LMS |
| Instructure (Canvas) | ~$430.6M (est.) | ~$475.2M (2022 est.) | N/A | Private since 2021; ~50% enrollment share in N. America |
| Anthology (Blackboard) | ~$728.2M (est.) | ~$700M (2018 est.) | N/A | Private; losing market share; ~12% enrollment share |
| Moodle | ~$66.5M (est.) | ~$76.3M (2025 est.) | N/A | Open-source; ~9% enrollment share in N. America |
D2L Brightspace has overtaken Anthology Blackboard for the second-place position in the North American higher education LMS market by enrollment share, now sitting at approximately 20% versus Blackboard’s 12%. Canvas (Instructure) continues to dominate at roughly 50% enrollment share.
How the Market Reacted?
D2L’s stock initially showed resilience on April 1, 2026 – the earnings release date – trading at $8.58, but then declined a further 8.74% the following day to close at $7.83 on April 2, the same day as the earnings call. The Q4 revenue of $55.8 million came in slightly below the FactSet consensus estimate of $56.6 million, a narrow miss that combined with concerns around ongoing U.S. K-12 churn and database migration margin headwinds to weigh on sentiment.
Analyst price targets remain well above current levels, with RBC lowering its target to $15 and buy-side consensus ranging from $9.38 to $15.94, suggesting the sell-off may reflect near-term caution rather than a fundamental re-rating. The stock is down approximately 41% year-to-date as of early April 2026, reflecting broader market pressure and sector-level multiple compression alongside the company-specific K-12 headwinds.