


Boeing reported core EPS of ($0.20) on revenue of $22.2 billion, with a narrower GAAP loss per share of ($0.11) as higher deliveries lifted the top line but margins and cash flow remained weak. The stock moved higher in early trading as investors focused on improving cash burn and record backlog rather than the headline loss.
About Boeing
Boeing Company (NYSE: BA) is a leading global aerospace and defense manufacturer that designs, builds, and services commercial jetliners, military aircraft, satellites, and space systems. Founded in 1916, the company is headquartered in Arlington, Virginia, and operates through three primary segments: Commercial Airplanes, Defense, Space & Security, and Global Services. Boeing plays a central role in global aviation infrastructure, supplying aircraft and related services to airlines, governments, and leasing companies worldwide.
As of the Q1 2026 earnings release, Boeing reported a record total backlog of $695 billion, including more than 6,100 commercial airplanes valued at approximately $576 billion. The company ended the quarter with $20.9 billion in cash and investments in marketable securities and consolidated debt of $47.2 billion.
Boeing generated ($179 million) in operating cash flow and ($1.454 billion) in free cash flow during the quarter, reflecting continued investment and cash usage despite higher deliveries. The release did not specify current P/E or dividend yield, and Boeing continues to operate without a common stock dividend while it focuses on balance sheet repair.
Top Financial Highlights
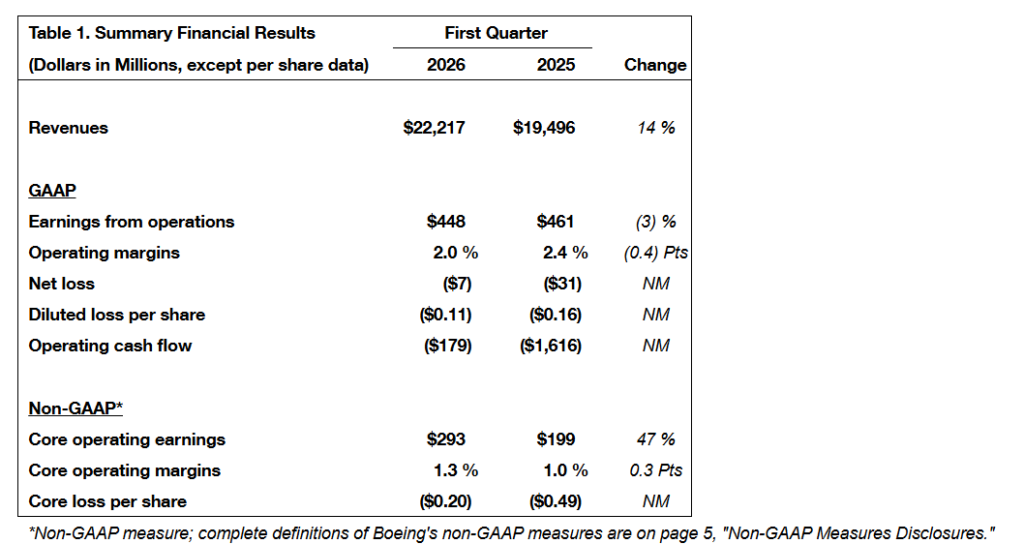
- Total revenue rose to $22.2 billion in Q1 2026, up 14% from $19.5 billion a year earlier, driven primarily by higher commercial aircraft deliveries.
- Net loss attributable to Boeing shareholders narrowed to $4 million, versus $37 million in Q1 2025, with net loss attributable to common shareholders of $90 million after preferred dividends.
- GAAP diluted loss per share improved to ($0.11) from ($0.16) a year ago, reflecting better operating performance and lower net loss.
- Core loss per share (non-GAAP) came in at ($0.20), significantly better than ($0.49) in Q1 2025, as core operating earnings improved year over year.
- Core operating earnings were $293 million, up 47% from $199 million in the prior-year quarter, with core operating margin of 1.3% compared to 1.0% last year.
- GAAP earnings from operations were $448 million, slightly below $461 million a year earlier, with operating margin of 2.0% versus 2.4%.
- Operating cash flow was ($179 million), a sharp improvement from ($1.616 billion) in Q1 2025, helped by advances and progress billings and higher deliveries.
- Free cash flow (non-GAAP) was ($1.454 billion), better than ($2.290 billion) a year earlier, as higher operating cash flow partially offset increased capital expenditures of $1.275 billion.
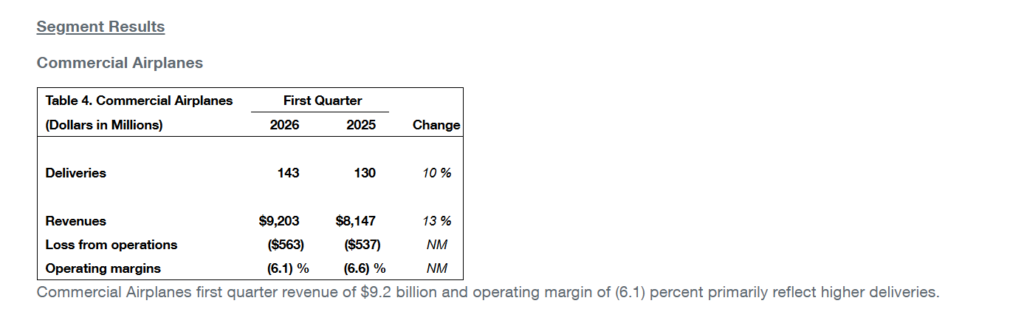
- The Commercial Airplanes segment delivered 143 jets and generated $9.203 billion in revenue, up 13% from $8.147 billion, with an operating margin of (6.1) %.
- The Defense, Space & Security segment posted $7.599 billion in revenue, up 21% from $6.298 billion, with operating earnings of $233 million and margin of 3.1%.
- The Global Services segment delivered $5.370 billion in revenue, up 6% from $5.063 billion, and operating earnings of $971 million, with a strong 18.1% margin.
- Total company backlog reached a record $694.7 billion, including $575.6 billion in Commercial Airplanes, $85.8 billion in Defense, Space & Security, and $33.0 billion in Global Services.
- Cash and investments in marketable securities totaled $20.9 billion at quarter end, down from $29.4 billion at 4Q 2025, reflecting $6.95 billion of debt repayments and negative free cash flow.
- Boeing maintained access to $10.0 billion in undrawn credit facilities, supporting liquidity while it continues to reduce its $47.2 billion consolidated debt load.
- Management reiterated a focus on safety, quality, and production stability across the 737, 787, and 777X programs, with certification of the 737-7 and 737-10 and first 777-9 deliveries expected in 2027.
Beat or Miss?
Available third‑party data indicate that Boeing beat bottom‑line expectations but was roughly in line to slightly below various revenue estimates, with different data providers reporting modestly different consensus figures.
| Metric | Reported | Difference / Analysis |
| Revenue | $22.22 billion | Versus estimates in the $21.6-22.6 billion range, implying roughly in‑line to low‑single‑digit beat or miss depending on source. |
| Core EPS (non‑GAAP) | ($0.20) | Material beat versus consensus loss expectations in the ($0.66)-($0.85) range, reflecting better margins and cost control. |
| GAAP diluted EPS | ($0.11) | Narrower loss than prior year; not directly compared to consensus in cited sources, but directionally better than feared. |
| Operating cash flow | ($179 million) | Improved versus ($1.616 billion) last year; consensus cash flow expectations were not specified, but the trajectory is positive. |
| Free cash flow (non‑GAAP) | ($1.454 billion) | Better than ($2.290 billion) a year ago, though still a sizeable outflow. |
| Commercial revenue | $9.203 billion | Up double digits year on year; no explicit external consensus provided for the segment. |
| Defense revenue | $7.599 billion | Up 21% year on year; segment performance benefited from higher volume and fewer disruptions. |
| Global Services revenue | $5.370 billion | Up 6% year on year with high‑teens margin, reinforcing services as a profit anchor. |
What Leadership Is Saying?
“We’re building on our momentum with a strong start to the year and growing record‑breaking backlog across our business, while supporting our customers with inspiring missions like Artemis II,” said Kelly Ortberg, President and Chief Executive Officer of Boeing.
“With a continued focus on safety and quality, we’re delivering high‑quality commercial and defense products and services, while increasing production to uphold our customer commitments and get back to the iconic global aerospace company that leads our industry,” said Kelly Ortberg, President and Chief Executive Officer of Boeing.
Historical Performance
Boeing YoY Q1 Comparison
| Category | Q1 2026 | Q1 2025 | Change (%) |
| Revenue | $22.217 billion | $19.496 billion | +14% revenue growth. |
| Net loss | $7 million | $31 million | Material improvement, though still a loss (not meaningful for strict %). |
| Net loss to common | $90 million | $123 million | Narrowed loss to common shareholders. |
| Earnings from operations | $448 million | $461 million | Down 3%, reflecting mix and margin pressure. |
| Operating margin | 2.00% | 2.40% | Down 0.4 points. |
| Operating cash flow | ($179 million) | ($1.616 billion) | Large improvement in cash usage, “NM” in company tables. |
| Free cash flow | ($1.454 billion) | ($2.290 billion) | Better free cash flow, still negative. |
From a segment view, Commercial, Defense, and Global Services each posted year‑on‑year revenue growth, with particularly strong increases in Defense and Commercial airplanes. Margins, however, remain compressed in Commercial, where the operating margin stayed negative despite higher deliveries and revenue.
Competitor YoY Snapshot
To contextualize Boeing’s Q1 2026, the table below uses Airbus’s most recent disclosed Q1 figures as a proxy competitor view. Exact 2026 Airbus numbers are not in the Boeing release but are taken from recent external reporting on Airbus’s quarter; where precise Q1 2026 data are not yet fully available, prior‑year Airbus Q1 2025 figures are used as a reference. These competitor metrics should be treated as directional rather than directly comparable, given differences in reporting and timing.
| Category | Boeing Q1 2026 | Boeing Q1 2025 | Change (%) |
| Revenue | $22.217 billion | $19.496 billion | +14%. |
| Net loss | $7 million | $31 million | Improved, still a loss. |
| Operating margin | 2.00% | 2.40% | (0.4) points. |
| Category | Airbus Q1 (latest available)* | Airbus prior‑year Q1* | Change (%) |
| Revenue | ~€13–14 billion range | Lower‑teens € billions | High single‑ to low‑double‑digit growth, driven by higher deliveries. |
| Net income | Positive | Positive | Profitability maintained; Airbus remains structurally more profitable in narrow‑body programs. |
| Operating margin | Mid‑single‑digit % | Mid‑single‑digit % | Relatively stable, reflecting mature A320neo family economics. |
How the Market Reacted?
Following the Q1 2026 earnings release, Boeing shares rose around 4.7% in pre‑market trading, with some reports noting an opening move of about 4.6%, signaling investor relief and optimism. The market appeared to focus on the narrower loss, improved core EPS, and sharply better operating cash flow compared with last year.
Record backlog across all three segments and evidence of production stability in programs like the 737 and 787 also supported sentiment. Despite ongoing losses and negative free cash flow, the tone of the stock reaction was cautiously bullish as investors weighed execution progress against remaining balance sheet and certification risks.